Notes from the margin.
Plain-English thinking on profit, demand, attribution and getting analytics to actually drive a decision. Written by the team that builds the platform.
Revenue is not the result. Margin is.
A 4x ROAS and a CFO's loss are both true; contribution margin is the number that reconciles them, and the breakeven-ROAS formula shows why.
The three CACs every operator confuses
Blended, new-customer and marginal CAC are three different numbers that answer three different questions. Most decks report one and reason as if it were another. The expensive one is the one almost nobody computes.
Why your CAC number is probably wrong
Two operators can both quote their cost to acquire a customer and both be telling the truth, while one number is nearly three times the other. The gap is not error. It is definition.

Weather moves 35% of GDP. Here is how much it moves your demand.
Most operators treat weather as noise to apologise for in a bad month. It is a measurable, leading demand signal. Here is the math that turns a cold snap into a budget decision you can make 30 days early.
Roofing spikes the same week. HVAC lags a quarter.
A single storm front moves two trades on two different clocks. Treat them the same in your media plan and you will overspend into a roofing trough and miss the HVAC peak entirely. The fix is to read the lag, not the headline.
The 30 to 45 day window: forecasting demand before it lands
Weather forecasts stay sharp for about a week. Demand for weather-driven products turns a month or more before that. The gap between the two is exactly where a marketing budget gets committed, and it is the reason the forecasting question is not what will the weather be but what can we commit to now and still be right.

Why three platforms all claimed the same sale
One buyer, one order, three platforms each reporting plus-one. Add the dashboards up and they claim more sales than the business actually made. Here is the mechanism, the math, and what to trust instead.
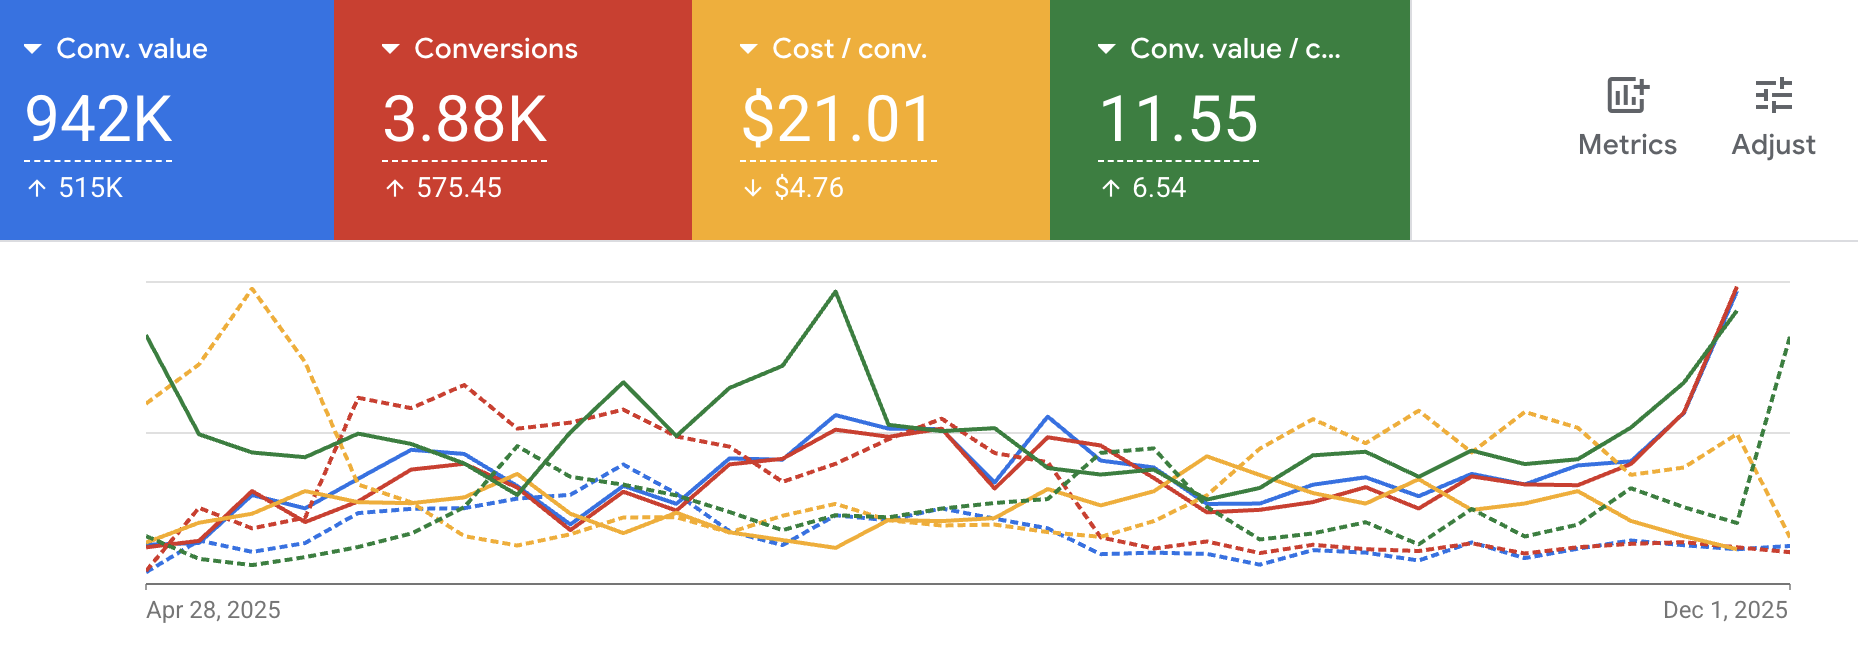
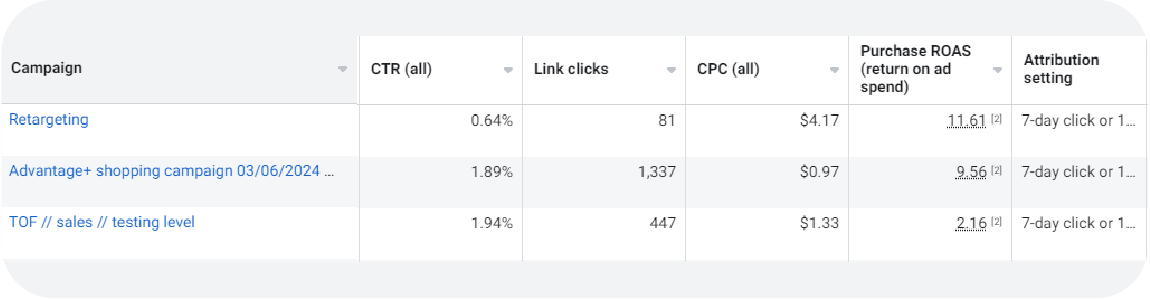
ROAS lies. Profit-led measurement is what is left.
Return on ad spend is the most trusted number in marketing and one of the least reliable. It double-counts sales, ignores margin, and rewards demand you already owned. Here is the arithmetic that replaces it.
81% of your customers never come back. The second order is everything.
Across 156,000 real DTC customers, fewer than one in five place a second order. The brands that win are not the ones with the best acquisition. They are the ones who treat the second purchase as the metric that compounds everything else.

Retention curves: declining, flattening, smiling
A single repeat-rate number hides the only thing that matters. The shape of the cohort curve tells you whether you have a product people come back to, a leaky bucket, or something rare enough to compound. Here is how to read it, and the textbook math to fit it.
Email and SMS are not retention. They are acquisition you already paid for.
Owned channels get filed under retention and treated as a margin sink. The numbers say something else: every order an automated flow drives is a sale you are not paying a platform to win again, which makes it the cheapest acquisition you will ever run.
A $10 lead that never closes costs more than a $200 lead that does
Lead price is the number on the invoice. Lead value is what the lead is worth once it closes and pays. Confuse the two and you will starve your best channel to feed your cheapest one.
Most companies still do not track win-rate by source
Most sales teams report one win rate for the whole pipeline. It is the single most expensive average in the business, because it hides the fact that some sources convert twenty times better than others. When you stop measuring the blend and start measuring the source, the next budget decision makes itself.