92%
Know whether you are acquiring efficiently, and how fast it converts.True CAC and payback. Cycle time and lag.
Pipeline Economics & Velocity is the CFO's view of growth: what a customer really costs once loaded through the funnel, how fast acquisition pays back, which sources compound, how quickly deals move through each stage, and what will actually land once in-flight pipe is corrected for your real cycle. Cost efficiency and time efficiency, reconciled in one view.
Pipeline EconomicsDemonstrative data
Cost per enquiry · as it escalates through the funnel
Per enquiryraw acquisition
$116
Per qualifiedafter qualification
$198
Per quoteafter quoting effort
$305
Per won (CAC)fully loaded
$584
Acquisition looks cheap at $116 an enquiry; loaded through to a won deal the true CAC is $584. The gap is where efficiency is won or lost.
CAC at won
$584
▼ 9%
Cost / enquiry
$116
▼ 6%
Pipe coverage
1.8×
▲ 0.3×
Payback
94d
▼ 11d
LTV:CAC
4.1:1
healthy
Median cycle
58d
▼ 6d
Top-5 share
32%
of won $
Service analytics from the team behind $150M+ in revenue influenced


What it answers
The questions a CFO asks about growth.
Not cost-per-lead. True CAC, coverage, payback and the sources that actually compound.
01
Are we acquiring efficiently?
True cost to win a deal, loaded through the whole funnel, not the flattering cost-per-enquiry number.
02
What does a customer really cost, by stage?
Cost per enquiry, per qualified, per quote and per won, so you see where acquisition gets expensive.
03
How much pipeline do we have against plan?
Pipe coverage by region and group, so you know whether the quarter is covered before it is over.
04
How long until acquisition pays back?
Payback in days against deal value, so spend decisions account for the cash gap, not just the return.
05
Is our LTV-to-CAC healthy, by source?
Lifetime value against fully-loaded cost per source, so you scale the channels that compound and cap the ones that do not.
06
Where is revenue concentrated, and is that a risk?
Top-account share of won revenue, so concentration is a number you manage, not a surprise.
07
Where in the funnel does time leak?
Time-in-stage at every step, so the stage quietly adding weeks to the cycle is exposed, not the blended cycle number that hides it.
08
What is genuinely bankable once corrected for lag?
A lag-corrected forecast that separates won, near-certain and projected, so the number you plan against is honest.
Pipe coverage
Know if the quarter is covered, by region.
A group coverage number can hide a region running on empty. The coverage grid shows pipe against plan by region and quarter, so you direct pipeline-building where it is actually short, before the gap becomes a miss.
- Region by quarter - coverage against plan, over time
- The short region - where to build pipe next
- Early, not in hindsight - a gap flagged with time to act
Pipeline Economics · coverageLive
Pipe coverage · region × quarter (× plan)
Q1
Q2
Q3
This Q
Metro
1.4×
1.6×
1.7×
1.9×
Northern
1.2×
1.3×
1.5×
1.6×
Southern
1.0×
1.1×
1.2×
1.4×
Regional
0.8×
0.9×
1.0×
1.1×
Metro is well covered at 1.9× plan; Regional trails at 1.1× - where the next bit of pipeline-building should aim.
LTV:CAC by source
Scale what compounds, cap what does not.
A source can win deals and still lose money once cost is loaded and lifetime value is counted. LTV:CAC by source separates the channels that compound from the ones that barely clear cost, so budget follows the economics.
- Loaded cost - CAC through the whole funnel, not per lead
- Lifetime value - repeat and expansion included
- The compounding channels - ranked for you to scale
Pipeline Economics · LTV:CACLive
Lifetime value vs loaded CAC · by source
Up and to the left is best - high lifetime value at low cost. Repeat sits top-left ($54k LTV, $66 CAC, 8.2:1); Google is bottom-right, barely clearing its loaded cost at 1.7:1.
Payback
Account for the cash gap, not just the return.
A high-return channel that takes four months to pay back is a different decision from one that pays back in a month. Payback by source puts the cash-flow cost of acquisition on the table, so growth is funded sustainably.
- Days to recover - loaded CAC against deal value
- Cash-flow aware - the gap before a channel pays
- Fund growth safely - scale within your cash reality
Pipeline Economics · paybackLive
Payback · days to recover loaded CAC, by source
Repeatfastest
31d
Referral
58d
Partner
88d
Website
112d
Googleslowest
134d
Repeat pays back in a month; Google takes over four. Payback is the cash-flow cost of a channel, not just its return.
Stage velocity
See exactly where time leaks.
A 58-day cycle can hide one stage doing all the damage. Median time at every step shows where deals sit, so you shorten the cycle at its real bottleneck rather than pushing everywhere. The same signal, read by source, exposes a channel that quotes big but closes slowly.
- Median and tail - the days each stage really takes
- The real bottleneck - the step adding the most time
- By source - which channels drag, which convert fast
Pipeline Economics & Velocity · stagesLive
Median time-in-stage · days, in funnel order
Enquiryfastest
5d
Qualified
10d
Quotebottleneck
18d
Negotiation
12d
Quote is the slowest stage at a median 18 days, with a long tail. Shorten the cycle there and the whole 58-day clock moves, not at the stages that are already fast.
Lag-corrected forecast
Plan against an honest number.
A CRM total counts every open deal as if it will land on time. Corrected for your real cycle and win rates, the bankable number is lower and truer. We separate what is won, what is near-certain, and what is merely projected, so the forecast you commit to holds up.
- Won, near-certain, projected - the forecast split by certainty
- Lag-corrected - in-flight pipe aged against your real cycle
- Bankable - the number you can actually plan against
Pipeline Economics & Velocity · forecastLive
This quarter · bankable by certainty (× plan)
Wonbanked
$4.2M
Near-certainbankable
$6.0M
CRM totaluncorrected
$9.1M
The CRM says $9.1M; lag-corrected for cycle and win rate, the honest bankable number is $6.0M. Plan against the corrected figure, not the optimistic one.
Where the numbers come from
Built on your systems, reconciled to your records.
Pipeline Money is not a parallel set of figures. It joins the systems you already run into one number that ties out, then keeps it current.
☷Your CRM
Every deal, stage, owner and close date. We map your real pipeline stages with you, so the funnel matches how your business actually sells.
↗Your marketing channels
Spend, clicks and campaigns from every paid source, joined to the deals they created with server-side tracking, lag-corrected to your sales cycle.
⚙Your operations software
Quoting, job management and finance, so contracted and settled revenue is grounded in delivery, not just CRM optimism.
Proof
What operators get when the economics are clear.
When CAC is loaded honestly and payback is on the table, budget follows the channels that compound. A sample of the outcomes.
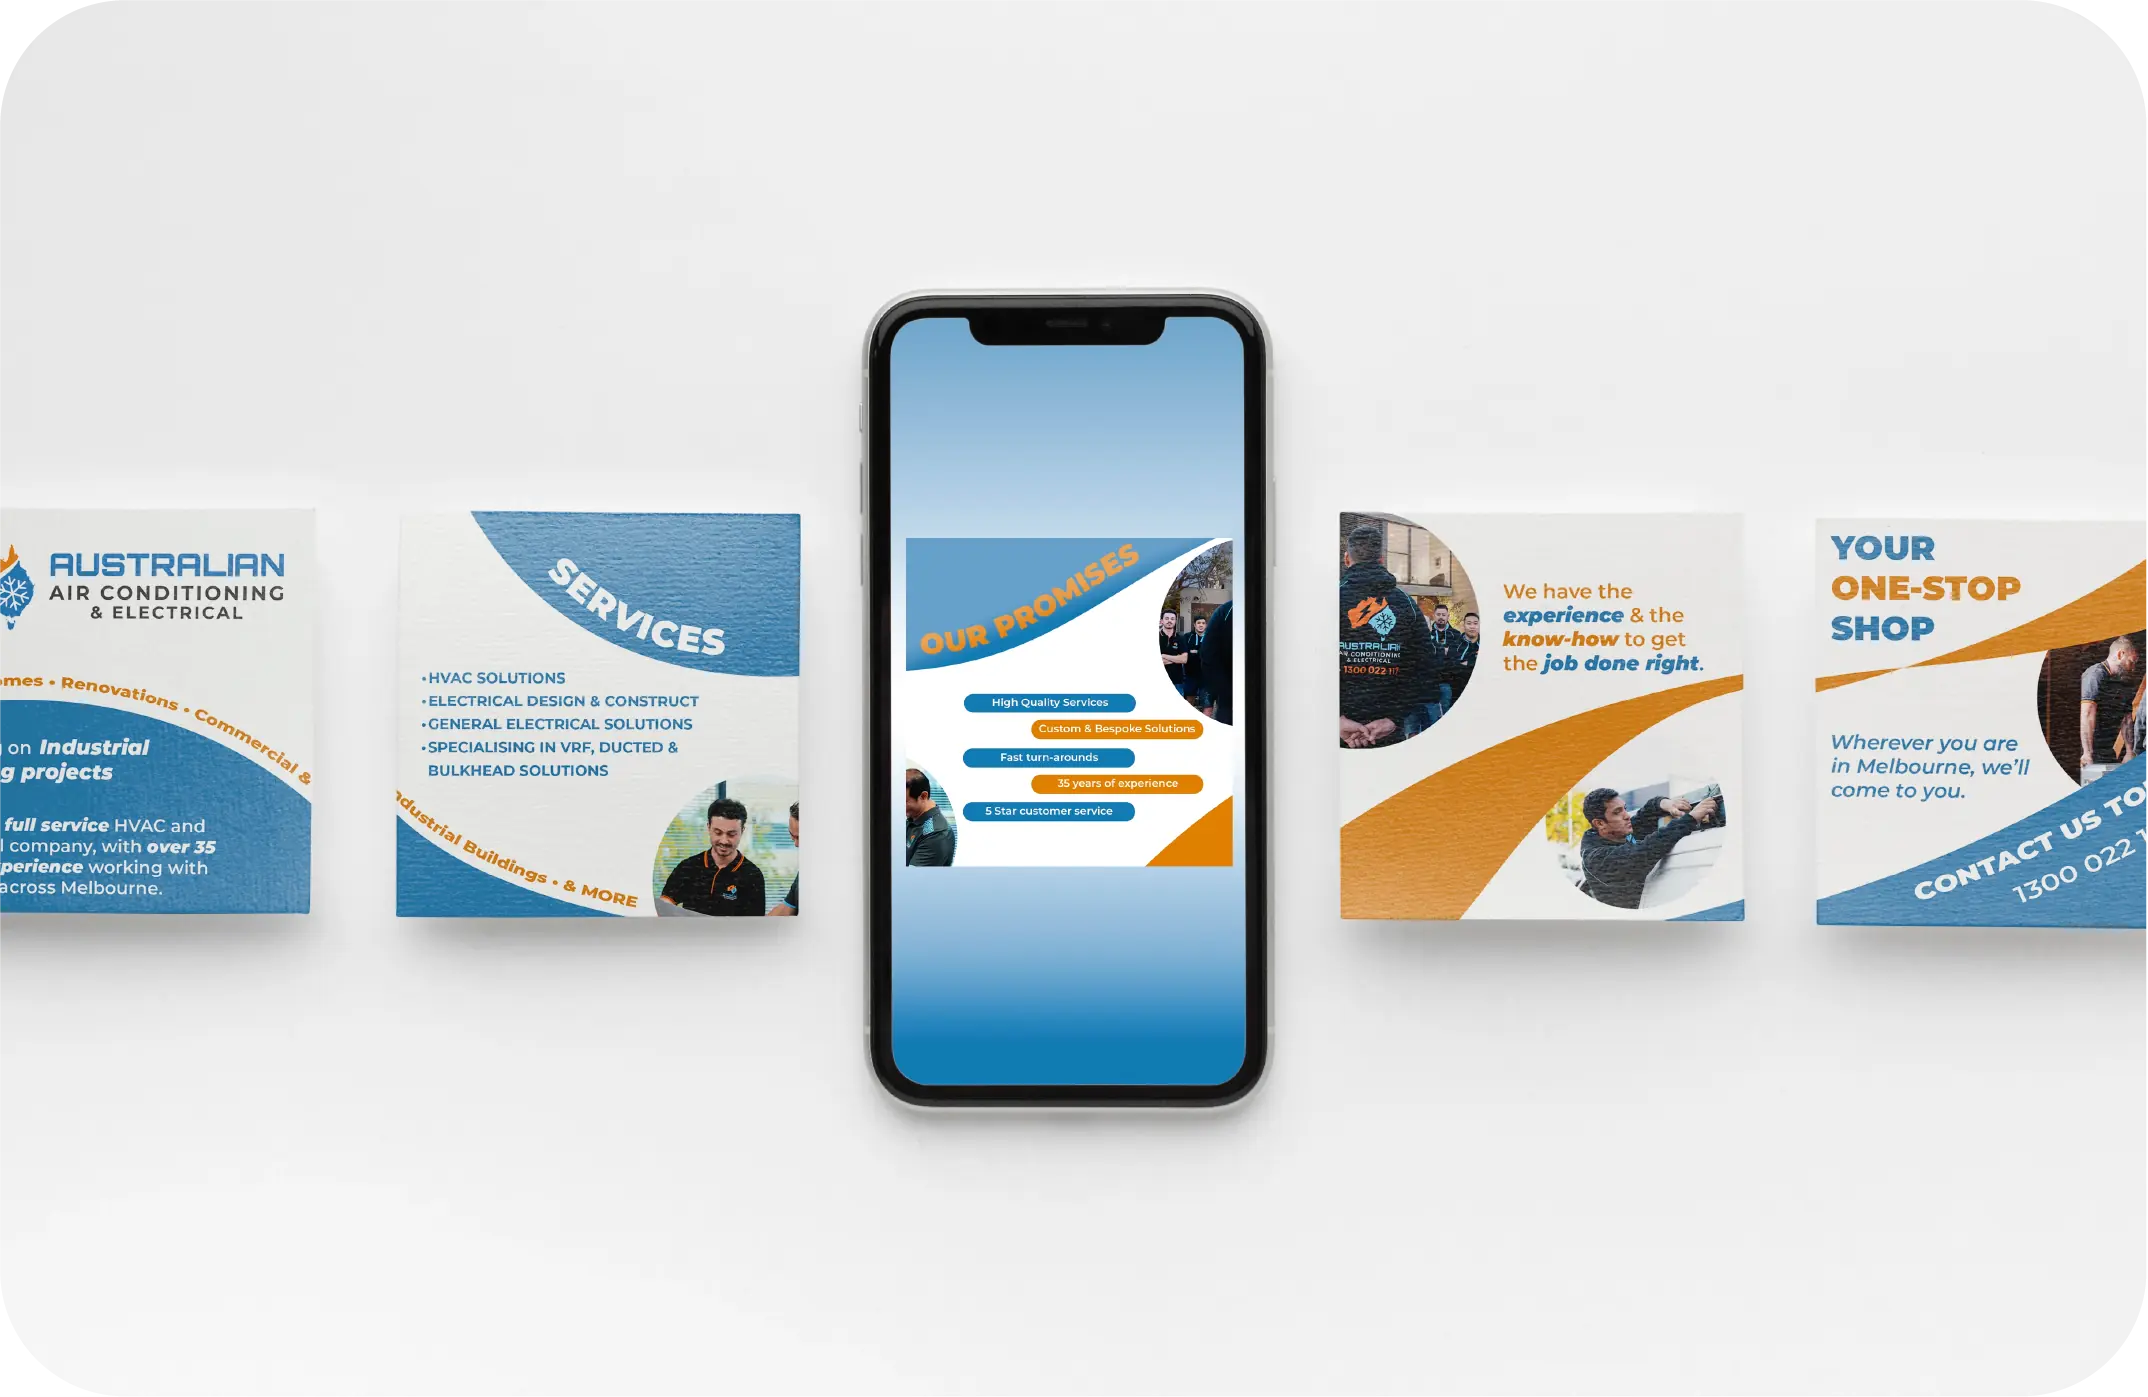 Field services
30:1return
Australian Air Conditioning & Electrical
Heating & cooling
$3M in closed revenue from $100K of spend - 2,600 qualified enquiries traced to the jobs they became over twelve months.
Read case study →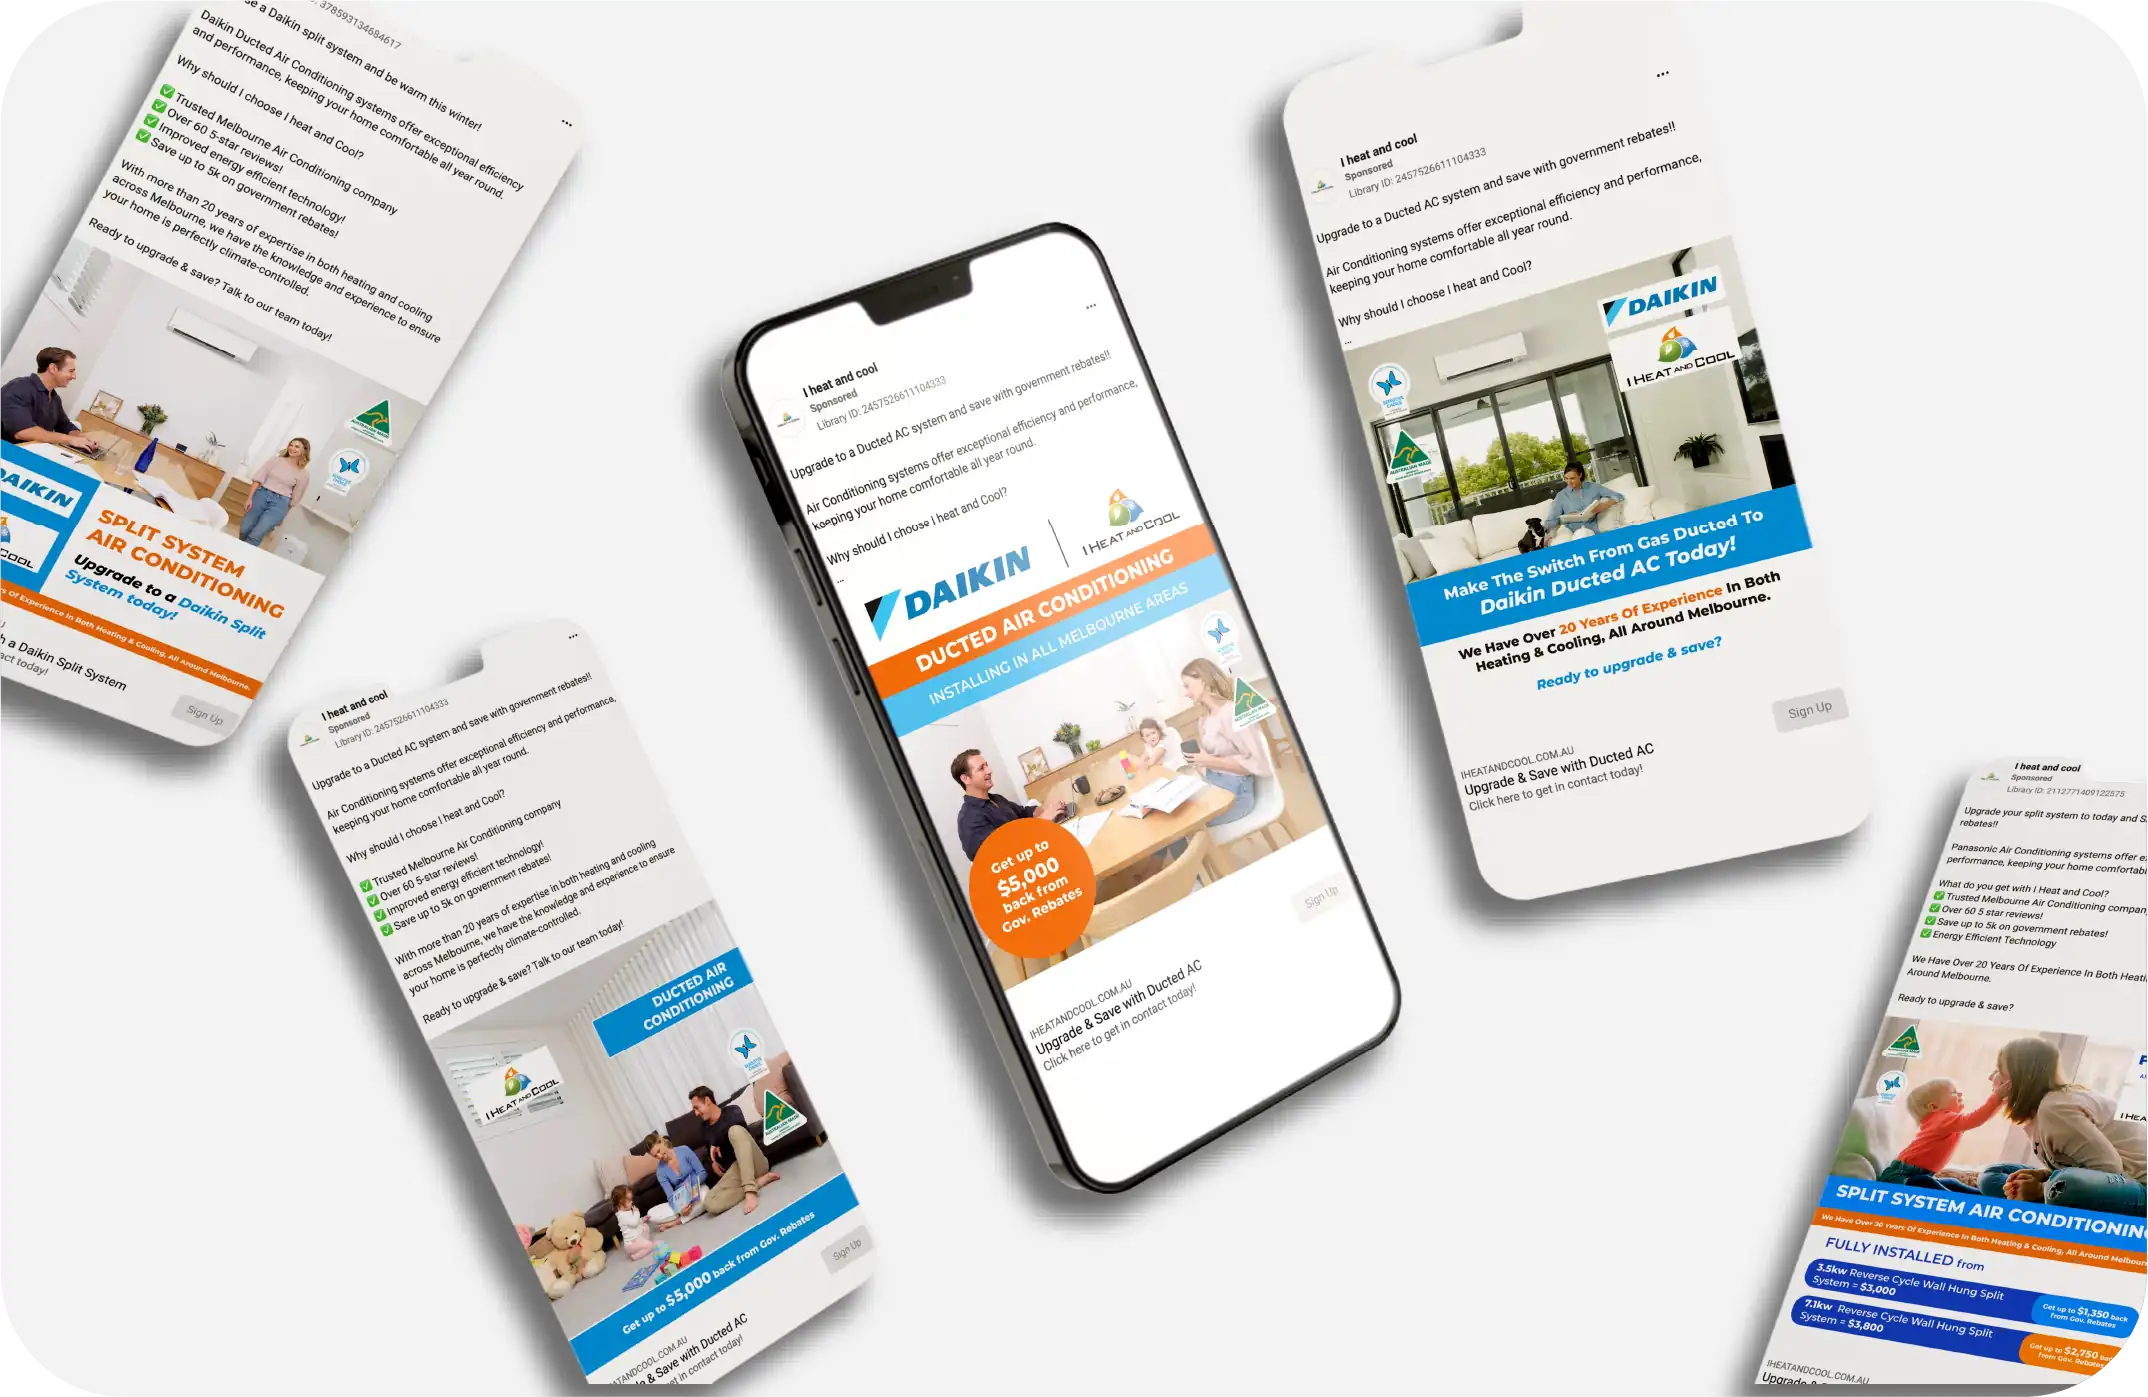 Field services
$5Mnew revenue
I Heat & Cool
Heating & cooling
A full year of new revenue with cost-per-deal cut from $90 to $41.95 once spend was judged on closed jobs, not leads.
Read case study → Field services
$840Kpipeline
King Cooling
Heating & cooling
1,500 enquiries at a $27 cost per enquiry, with 28% converting to booked jobs - visible, stage by stage, in one view.
Read case study →The rest of the picture
One view of eight.
Every dimension of your revenue, at the same depth, reconciled to the same source.
Pipeline Money →
Where revenue is won, contracted and in-flight.
Channels & ROAS →
Where the work comes from and which we win.
People & Performance →
Region, team and rep performance.
Won / Lost →
Why deals close or die.
Customers →
The full journey and where revenue concentrates.
Geography →
Zone and branch benchmarks.
Persona Identification →
Who your best accounts are and where to find more.
Pipeline Economics & Velocity ◆
CAC by stage, LTV:CAC, payback, cycle time and lag.
Questions
The things buyers ask.
Cost-per-lead counts the enquiry; our CAC loads the full cost of qualifying, quoting and winning, so it reflects what a closed customer actually costs - usually several times the headline number.
Closed plus repeat and expansion revenue from your CRM and finance systems, so lifetime value is money received over the relationship, not modelled potential.
Days to recover the fully-loaded CAC against realised deal value, by source, so the cash-flow cost of each channel is explicit.
Yes. Pipe against plan is shown by region and quarter, so you build pipeline where it is genuinely short rather than where it is loudest.
Yes. Spend, revenue and pipeline tie out to your source systems, so the unit economics are CFO-grade, not a dashboard estimate.
Cost efficiency and time efficiency are two halves of the same question. Alongside CAC and payback, we measure how long deals take at every stage and where time leaks, so you see both what a customer costs and how fast they convert.
In-flight deals have not finished maturing. We project them from your own historical time-to-won distribution, with confidence bands, so the bankable forecast neither overstates open pipe nor undercounts it.
With medians and tails (P75, P90), not averages, so a few stuck large deals do not distort the picture of how long a stage really takes.
See your true unit economics.
Connect your spend, CRM and finance systems. We load CAC honestly, measure payback and coverage, and rank sources by what they compound.
01
Connect your stack
Spend, CRM and finance. No data team.
02
Load the cost
CAC through the whole funnel.
03
Measure payback
Days to recover, by source.
04
Check coverage
Pipe against plan, by region.
05
Rank by LTV:CAC
Scale what compounds.