Revenue tells you how much money moved. Contribution margin tells you how much you got to keep.
This page gives you the whole method, free. Every formula is shown, every worked example is flagged as demonstrative, every benchmark is cited to its source. Run it in a spreadsheet this afternoon - or connect your store and let Blufire run it against your ledger, to the dollar.
Finaloop aggregated dataset: hundreds of 7-8 figure brands, US$3.16B annual sales, US$808M marketing spend. US data, 2023-2025.
The step-down from revenue to true margin
Contribution margin is what is left from a sale after the costs that move with that sale are removed. Not gross profit, which stops at cost of goods. Not net profit, which buries the signal under rent, salaries and software. It is the cleanest measure of whether the next order, the next campaign and the next customer make you richer or poorer.
Gross margin: can the product itself carry cost? A sourcing and pricing decision. Landed means cost plus freight-in plus duty.
Can the operation deliver it? An operations decision. For most DTC brands CM2 sits 10 to 15 points below CM1.
Can you acquire profitably? The marketing decision - what the order actually contributes after the cost of winning it.
Three rungs, three decisions. Framework as documented by Eightx, Saras Analytics and StoreHero; the full derivation is in our free contribution margin guide.
The order clears A$27.60 of contribution. Drop your own numbers in - the arithmetic is the whole trick.
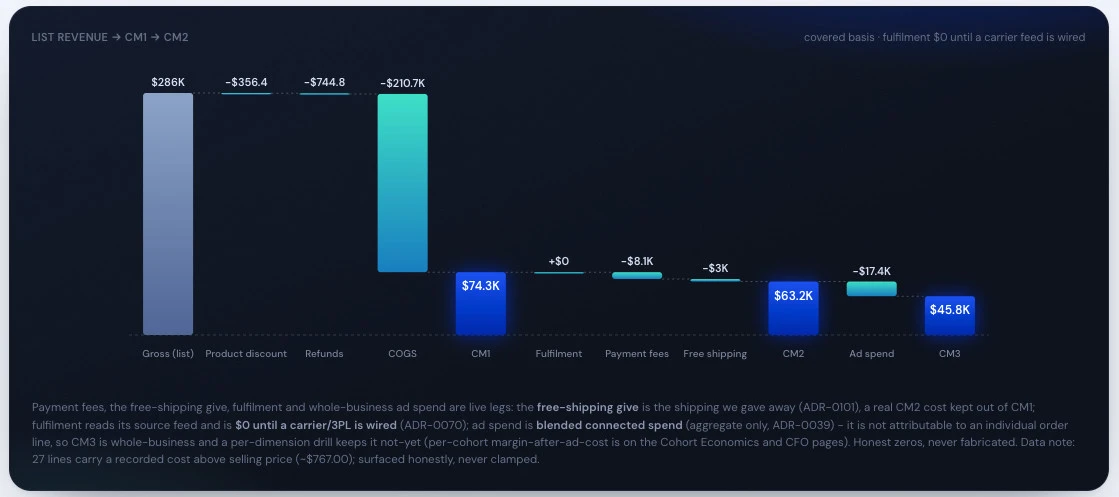
The same step-down, running live in Blufire on every order, customer and SKU - reconciled against your ledger to the dollar. See all 13 sections →
Why dashboards lie
ROAS has two structural flaws, and they compound. The first is that it counts revenue the platform claims, not revenue the platform caused. The second is that it measures revenue at all, when the business runs on margin.
Break-even ROAS is set by your margin, not your platform
Breakeven ROAS = 1 ÷ contribution margin, because the ad dollar spends from the margin pool, not from revenue. At 40% CM you need 2.5x just to cover variable cost. At 25% CM, 4.0x. At 70% CM, 1.43x. A 4x ROAS on a 25% contribution margin is a slow-motion loss; a 2.6x ROAS on a 70% margin is a thriving business. ROAS cannot tell those two apart.
Platforms claim credit for up to 140% of your actual revenue
One buyer who watches a TikTok video, later clicks a Google search ad, then sees a Meta retargeting impression generates a conversion in all three dashboards for a single real sale - because attribution windows overlap. Meta over-reports roughly 26% above third-party analytics on average; Google Ads runs 15% to 20% high under modelled conversions.
The sale might have happened anyway
The question that matters is not whether a channel touched the sale but whether the sale would have happened anyway. Branded search runs 60% to 80% non-incremental and retargeting 40% to 70% - in the eBay field experiment, almost all forgone paid clicks were immediately recaptured by organic results. A documented Meta test showed 2.1x true incremental return against 4.8x platform-reported.
Your average CAC hides the CAC that matters
Blended CAC = total S&M spend ÷ all new customers. Paid CAC = paid media spend ÷ customers from paid. Marginal CAC = Δspend ÷ Δcustomers - the cost of the next cohort, not the average of the last, and the only CAC that governs the scale decision. In one demonstrative channel, blended CAC across five spend tranches is about A$82 while the fifth tranche runs A$263. Same account, same month.
Demonstrative, but the asymmetry is real. Two orders, identical reported ROAS.
The dashboard shows two identical 3.4x campaigns. One is the best thing in the account and the other should be paused today. ROAS cannot tell them apart. Contribution margin can, instantly.
From our free library - Revenue is not the result
Tied out to the dollar
Revenue to true margin, reconciled to the dollar. COGS, shipping, fees and returns out. What's left is the number your accountant would sign.
Reconciled, with provenance on every figure.
How fast is tie-out? Fast. We reconciled a $5.76M store across 19,217 customers and 40,099 orders to the dollar. You see your real contribution margin in the first session.
How we keep the numbers honest
A receipt is only worth signing if the process behind it is strict. These are the rules every figure on this page, and every figure in the product, operates under.
Reconciled to an anchor
Every figure reconciles to an independent anchor before it ships. Not modelled against itself - checked against your ledger.
No fabricated zeros
We never coalesce a missing cost to zero. A gap shows as a gap, never as a number that flatters the margin.
Estimates say so
Where a number rests on an estimate, we say so. You always know which figures are measured and which are modelled.
Method in the open
Every formula is shown. Worked examples use demonstrative numbers, flagged as such, so you can drop your own in. External benchmarks are cited to their source.
The method is free. The automation is the product.
Everything on this page runs in a spreadsheet. Here is the whole recipe - no email gate, no call. If you would rather not rebuild it every week, that is the part we sell.
The spreadsheet recipe
Then repeat it weekly, for every order, customer and SKU, and reconcile each figure back to your ledger. That last step is the hard part - and the whole point.
Blufire runs it, reconciled
- True contribution margin on every order, customer and SKU, reconciled against your ledger to the dollar
- The same step-down you just read, refreshed weekly instead of rebuilt by hand
- Every figure reconciled to an independent anchor before it ships - estimates say so
- Free for 30 days, free to install
- A Free Analytics Session included:
$500FREE
Free for 30 days. Free to install.