92%
Know what your pipeline is really worth.Every dollar of spend, traced to closed revenue.
Pipeline Money is the single view of where revenue is won, contracted and in-flight. Spend traced through every stage to the deals it actually closes, lag-corrected for your real sales cycle, and reconcilable to the dollar. No vanity pipeline, no double-counting. The number your board can trust.
Pipeline MoneyDemonstrative data
Click139,760
Enquiry3,898
Qualified2,350
Quote806
Negotiation544
Won465
Spend
$452K
▲ 4.1%
Enquiries
3,898
▲ 9.2%
Quotes
806
▼ 1.4%
Negotiations
544
▲ 6.0%
Closed
$12.4M
▲ 18%
Blended ROAS
27.4×
▲ 0.9×
Pipeline analytics from the team behind $150M+ in revenue influenced


What it answers
The questions your leadership actually asks.
Not "how many leads." The board-level questions about where revenue truly is, what is going to close, and which dollars created it.
01
What is our pipeline genuinely worth right now?
Every open deal weighted by its stage probability and corrected for reporting lag, so in-flight revenue is neither overstated nor undercounted mid-cycle.
02
How much of the number is closed, contracted, or still in-flight?
One reconciled split of the quarter: realised, contracted and projected revenue, each tied out to its source records.
03
Where, in dollars, is revenue leaking?
The largest leak ranked by value at stake, not just conversion rate, so you fix the stage that costs the most, not the one that looks worst.
04
What will actually settle in the next 90 days?
A settlement-propensity forecast with a confidence band, built from your own historical lag distribution, not a straight-line extrapolation.
05
Which marketing dollars created the pipeline that closes?
Spend attributed to realised revenue, traced to source and campaign, separating the channels that fill the funnel from the ones that fill the bank.
06
Where is revenue stuck, and which deals are overdue?
Open value flagged where deals sit beyond their normal time-in-stage, so your team works the pipe that is quietly ageing out.
Stage funnel & leakage
See exactly where revenue leaks - in dollars.
A conversion rate tells you a stage is weak. It does not tell you what it costs. The leakage waterfall prices every drop-off in pipeline value lost, then ranks them, so the stage you fix first is the one bleeding the most money.
- Ranked by value at stake - the worst leak in dollars, not just the worst rate.
- Significance on every comparison - real movement is flagged; noise is not.
- Time-in-stage & loss reasons - why deals die at each stage, and how long they sat.
Pipeline Money · by stageLive
Stage funnel · leakage waterfall
Enquiryentered
3,898 · $48.7M
Qualified60.3%−$6.1M
2,350 · $34.1M
Quote34.3%−$9.2M
806 · $24.9M
Negotiation67.5%−$3.4M
544 · $18.2M
Won85.5%−$1.6M
465 · $12.4M
Largest leak: Qualified → Quote. $9.2M of qualified pipeline never reaches a quote (34.3% conversion vs 41% prior, significant).
Cohort quality
Know which enquiries actually become revenue.
Two months can bring the same number of enquiries and a completely different amount of money. The cohort view tracks each month's enquiries through to won revenue over time, so you can see quality drift before it shows up in the quarter.
- Lag-corrected maturity - young cohorts are projected from your real cycle, not written off.
- Source-quality drift - spot a channel whose leads stop converting, early.
- Like-for-like - every cohort on the same scale, so comparison is fair.
Pipeline Money · by cohortLive
Enquiry cohort · % reached won, by weeks since
Cohort
W0
W2
W4
W6
W8
W10
W12
Jun '26
0.4
1.1
2.0
·
·
·
·
May '26
0.5
1.4
2.8
3.9
4.6
·
·
Apr '26
0.6
1.6
3.0
4.4
5.5
6.1
·
Mar '26
0.5
1.5
3.1
4.7
5.9
6.7
7.0
Feb '26
0.7
1.8
3.4
5.0
6.2
6.9
7.3
Jan '26
0.6
1.6
3.2
4.8
6.0
6.8
7.1
% of enquiries won still maturing (lag-corrected on hover)
Forecast & in-flight
Know what is going to close - with confidence.
A settlement-propensity forecast built from your own lag distribution, not a trend line. The fan shows the range; the intelligence layer reads it for you: what to watch, what it means, and the hypothesis behind the number.
- Confidence bands - 50% and 90% intervals, so a forecast is a range, not false precision.
- Pipe coverage vs plan - how much of the target is already in the pipe.
- Backtested - the model is scored against its own last twelve forecasts.
Pipeline Money · forecastLive
⚡Forecast intelligence90% confidence
Watch90-day settlement forecast totals $18.2M (90% CI $15.1M–$21.6M). Bottom-up tracks 4.2% below the P50 in early weeks, consistent with current sales-cycle lag.
HypothesisA seasonal Q3 enquiry lift (+12%) offsets the quote-stage slowdown; pipe coverage holds at 1.8× the quarter's plan.
Cumulative settled $ · next 90 days
Where the numbers come from
Built on your systems, reconciled to your records.
Pipeline Money is not a parallel set of figures. It joins the systems you already run into one number that ties out, then keeps it current.
☷Your CRM
Every deal, stage, owner and close date. We map your real pipeline stages with you, so the funnel matches how your business actually sells.
↗Your marketing channels
Spend, clicks and campaigns from every paid source, joined to the deals they created with server-side tracking, lag-corrected to your sales cycle.
⚙Your operations software
Quoting, job management and finance, so contracted and settled revenue is grounded in delivery, not just CRM optimism.
Proof
What operators get when the pipeline is honest.
When every dollar of spend is tied to the revenue it closes, budget moves to what pays back and the pipeline stops lying. A sample of the outcomes.
 Field services
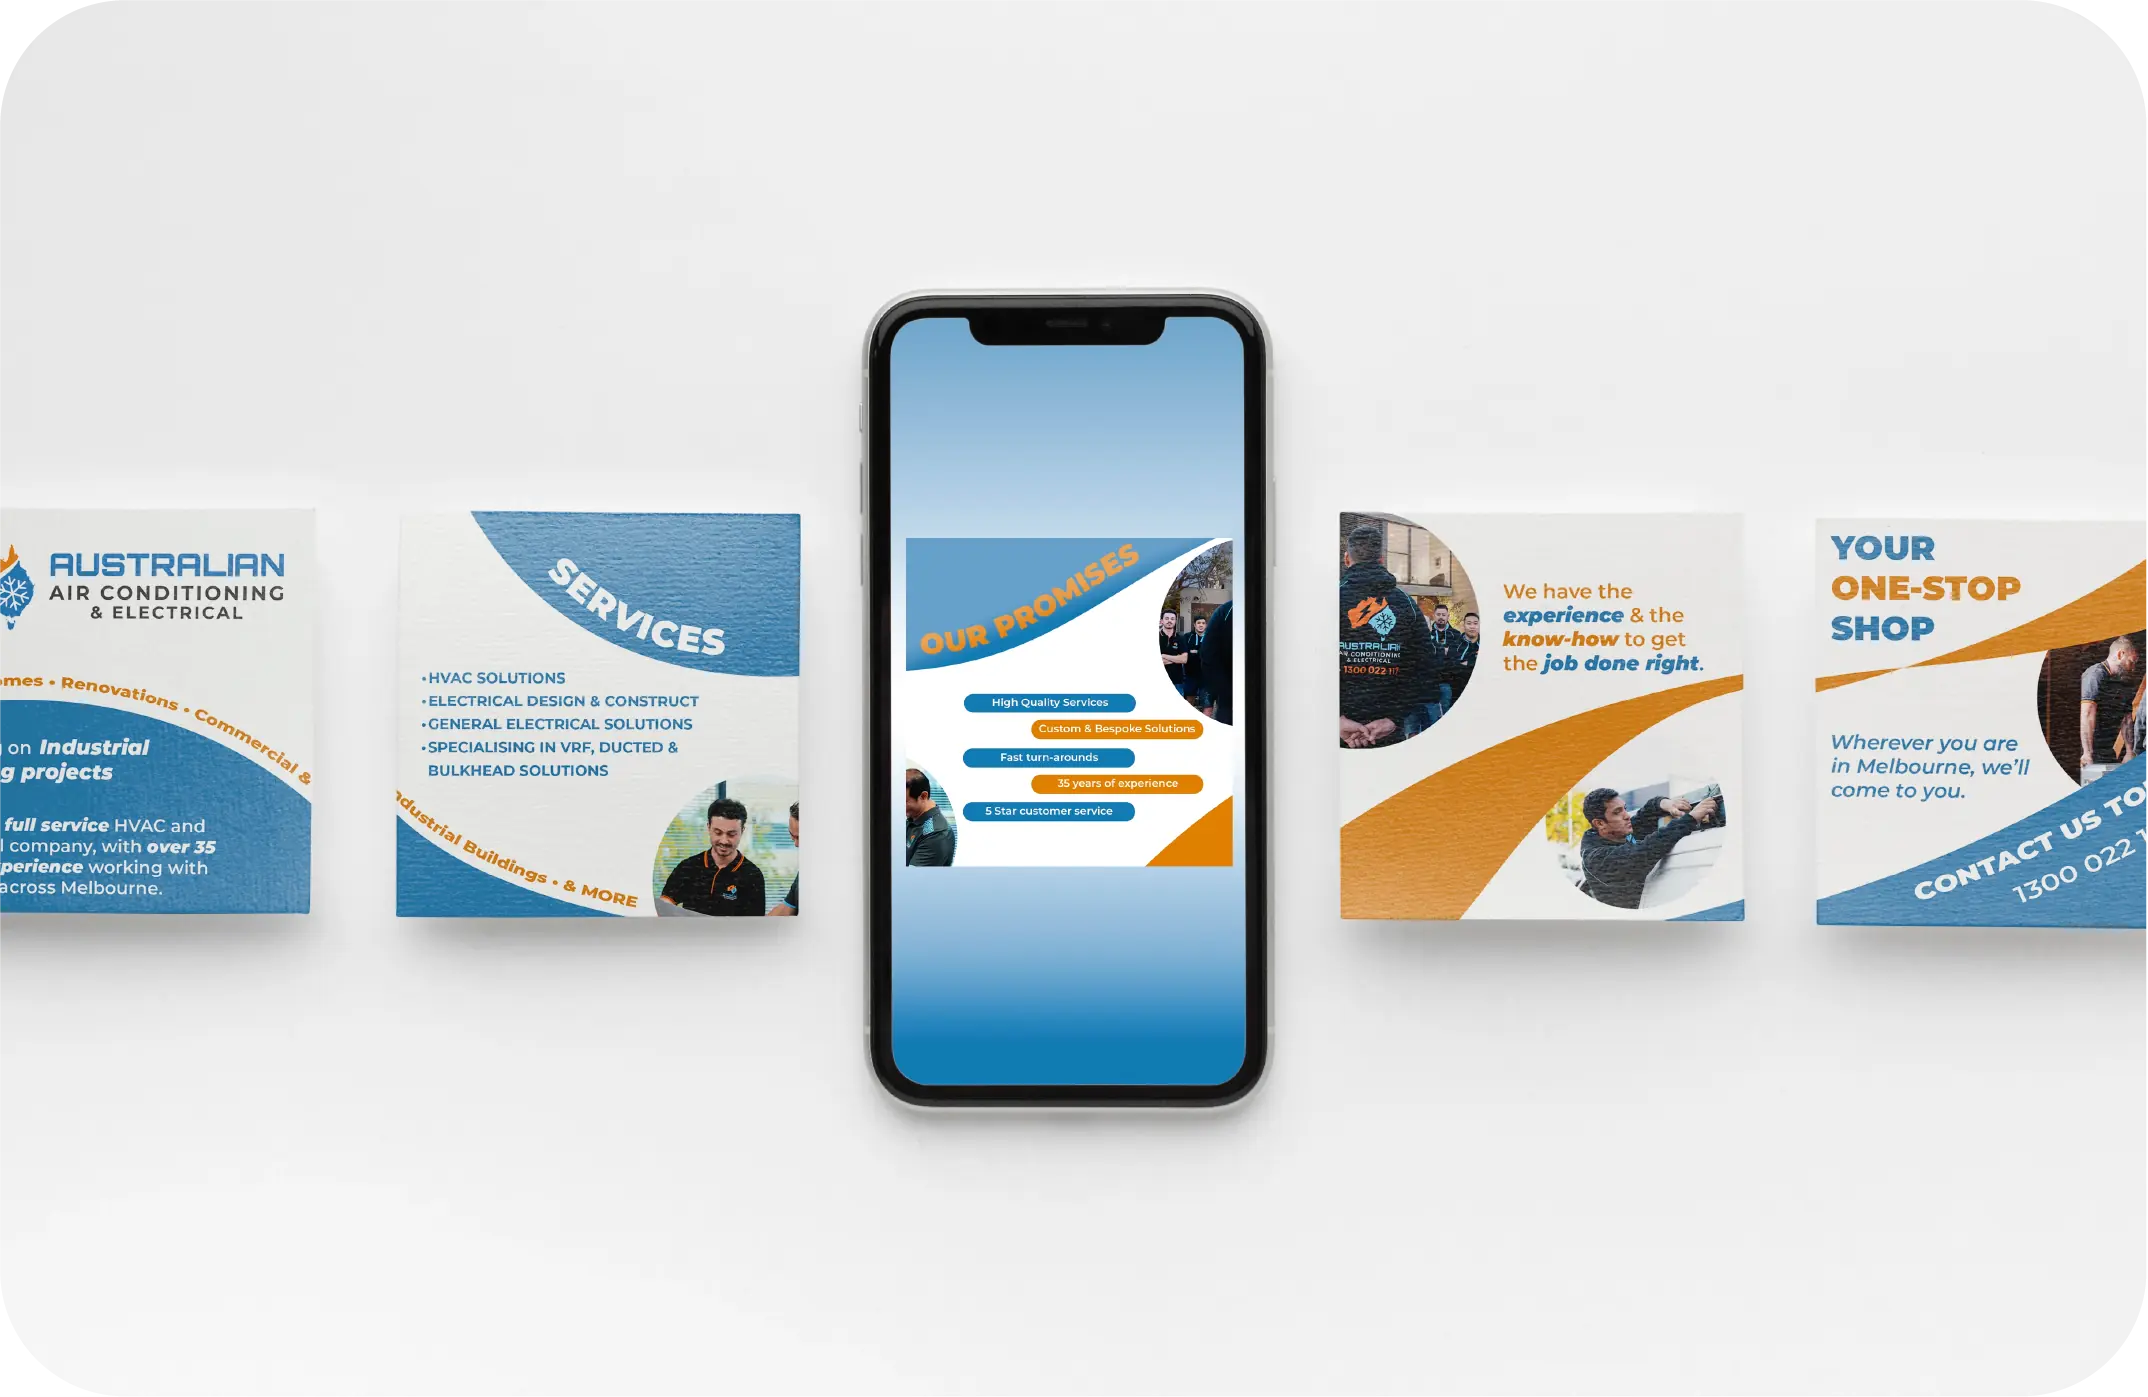
30:1return
Australian Air Conditioning & Electrical
Heating & cooling
$3M in closed revenue from $100K of spend - 2,600 qualified enquiries traced to the jobs they became over twelve months.
Read case study →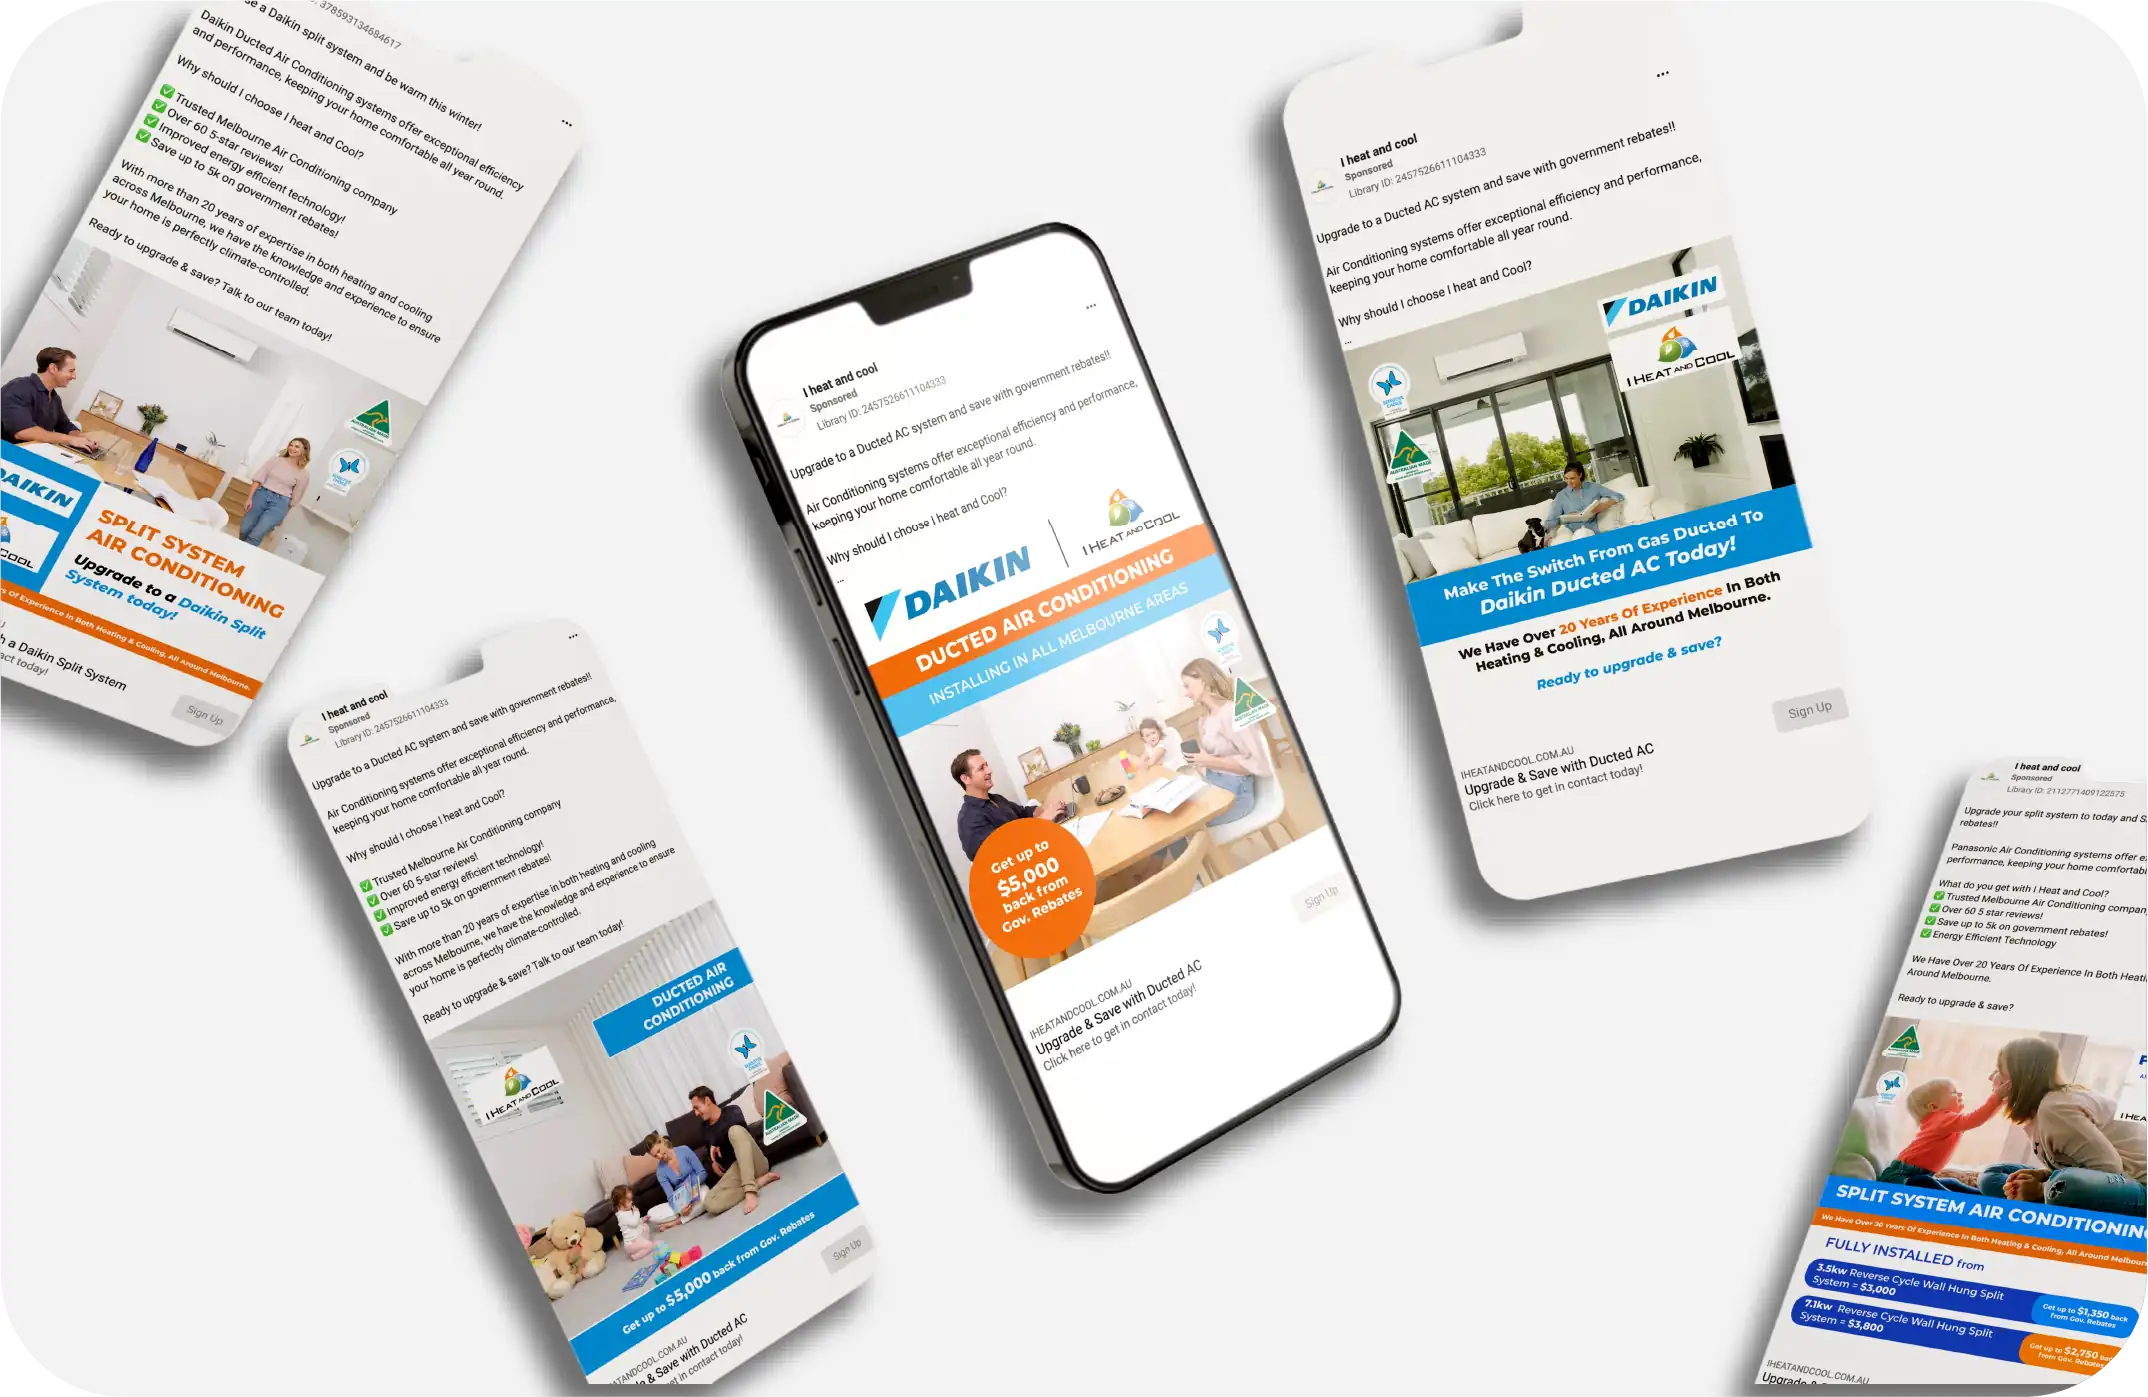 Field services
$5Mnew revenue
I Heat & Cool
Heating & cooling
A full year of new revenue with cost-per-deal cut from $90 to $41.95 once spend was judged on closed jobs, not leads.
Read case study → Field services
$840Kpipeline
King Cooling
Heating & cooling
1,500 enquiries at a $27 cost per enquiry, with 28% converting to booked jobs - visible, stage by stage, in one view.
Read case study →The rest of the picture
Pipeline Money is one view of nine.
Every dimension of your revenue, at the same depth, reconciled to the same source.
Pipeline Money ◆
Where revenue is won, contracted and in-flight.
Channels & ROAS →
Where spend pays back, to the campaign.
People & Performance →
Region, team and rep performance.
Won / Lost →
Why deals close or die.
Customers →
The full journey and where revenue concentrates.
Geography →
Postcode-level and branch benchmarks.
Persona Identification →
Who your best accounts are and where to find more.
Pipeline Economics →
CAC by stage, LTV:CAC, payback.
Questions
The things buyers ask.
Your CRM sums open deals at face value. Pipeline Money weights each by its stage probability, corrects for reporting lag, and reconciles closed and contracted revenue against your operations and finance systems - so the number ties out instead of flattering the forecast.
That is exactly what lag-correction is for. In-flight deals are right-censored, so we project maturing cohorts from your own historical lag distribution, with confidence bands, instead of letting you undercount mid-cycle.
No. We map your real stages with you in a short onboarding, so the flow and the leakage waterfall match how you actually sell rather than a generic three-stage template.
The forecast carries a confidence band and is backtested against its own last twelve forecasts, with the reliability shown. You plan against a range and its track record, not a single optimistic line.
It syncs continuously, and every figure is reproducible to its source: the query, the commit and the data snapshot that produced it. A dedicated database per customer, SOC 2 certified, hosted in Australia.
Read access to your CRM and ad platforms, and a short session to map your stages. No data team and no spreadsheets - we handle the joins and the reconciliation.
See your real pipeline in your first weeks.
Connect your CRM, channels and operations software. We map your funnel, reconcile every stage, and hand you a pipeline number you can take to the board.
01
Connect your stack
CRM, ad platforms and ops software. No data team required.
02
Map your funnel
Your real stages, mapped with us in a short onboarding.
03
Reconcile the pipeline
Closed, contracted and in-flight, tied out to source.
04
See where it leaks
Every stage priced in the revenue at stake.
05
Forecast with confidence
What will settle next quarter, with a confidence band.