
From a standing start to A$1M in under 12 months.
An Australian online liquor challenger launched from zero into one of retail's most price-brutal categories, up against national chains that own the shelf and the search results. The analytics treated price as data and conversion as a system, reading a thin-margin category to find where a brand-new store could genuinely win, and finding where the store leaked buyers before it was ever scaled.
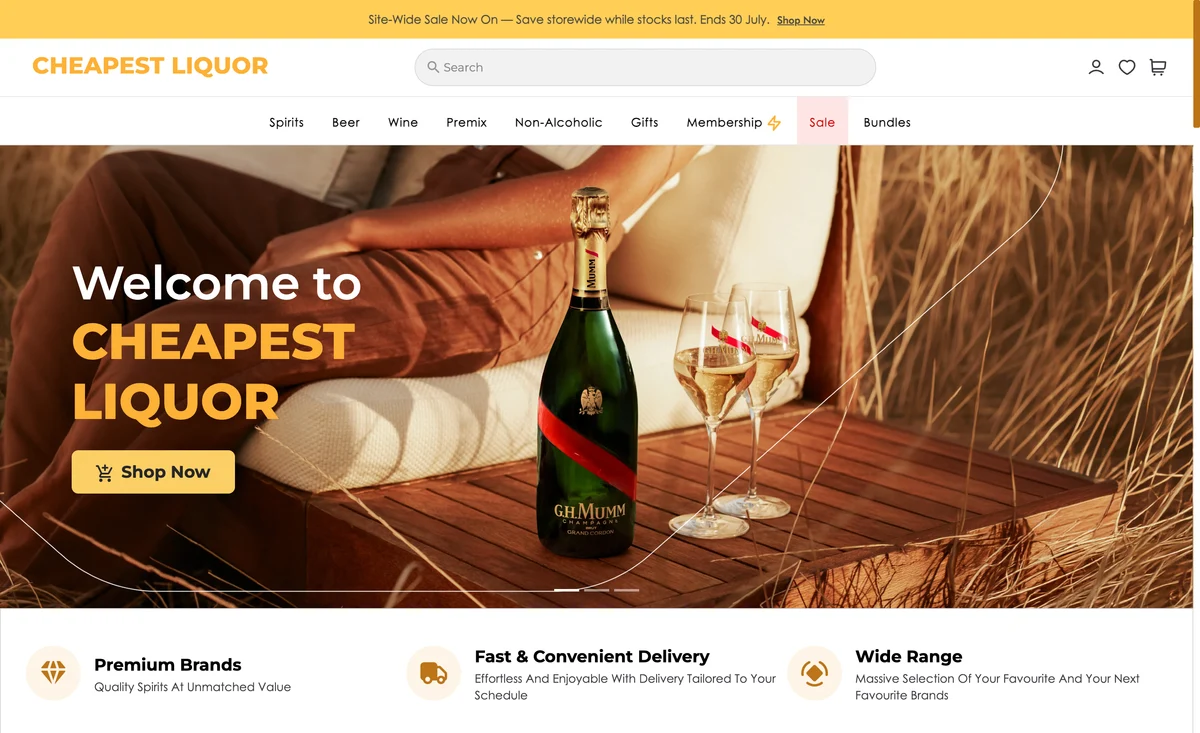
Win a price-led category with no brand, no history, and no room to be wrong.
Online liquor is one of the harshest corners of Australian retail. Margins are thin, shoppers compare every price to the cent, and a handful of national chains own both the shelf and the search results.
Cheapest Liquor was brand-new: no purchase history to learn from, no audience to lean on, and a name that set the bar at the lowest price in the market. The real questions were never about advertising. They were where, in a category defined almost entirely by price, a store with no history could actually win, and why the traffic it did get was leaking straight back out.
The analytics surfaced two blind spots. The catalogue ran to thousands of SKUs with no read on which ones the store was genuinely competitive on, so effort spread evenly meant winning nowhere. And the store converted at roughly 0.3%, a structural leak that would turn any growth into expensive proof that the category was unwinnable.
Treat price as data, and conversion as a system.
The work did not start with campaigns. It started by building a quantified picture of where this store could actually win, then rebuilding the store to convert the shoppers it would send there. Three disciplines, run in sequence.
Every SKU was scored on margin, demand and how the store's price compared against the market, so a catalogue of thousands resolved into a ranked map of where the brand was genuinely competitive. That told the business to stop spreading effort evenly and focus on roughly the top 1,000 products, the ones where price advantage, demand and margin all lined up. The long tail stayed live but stopped absorbing attention it could never repay.
In a category where the decision is almost entirely price, the competitive position of each product is the whole game. Continuous competitor-pricing intelligence kept the priority list anchored to real market position rather than a guess, so the focus always followed genuine evidence of advantage instead of hope.
A 0.3% conversion rate is a structural problem, not a traffic problem. The analytics traced the leaks in the path to purchase, then the store was rebuilt to close them, stripping friction and abandonment triggers out of the checkout and answering the trust objections that stop a first-time buyer from handing a card to an unknown store. Only a store that could hold a sale was worth sending shoppers to.
A new store became a million-dollar business in its first year.
Concentrating on a quantified set of winnable products, with the conversion leak closed underneath them, produced a step change rather than an incremental lift. From a standing start the store reached seven figures in turnover in under 12 months, and the work was recognised at the APAC Search Awards. The same model kept compounding well beyond the first year.
The pattern is what makes it repeatable. The growth was not bought by pushing more into a category that punishes weak conversion. It came from deciding where to compete using the data, making the store worth sending shoppers to, and only then scaling behind the products and a checkout that could carry the weight. Revenue scaled because the unit economics held, not in spite of them.