
From A$5k to A$170k a month in eight months.
A founder-run Australian designer tapware brand went from a A$5k-a-month standing start to A$170k a month in eight months, a 34x run rate, by letting the analytics name its real customer and surface the one product hiding in its own data that was carrying the business.
A premium catalogue, and no idea who it was for.
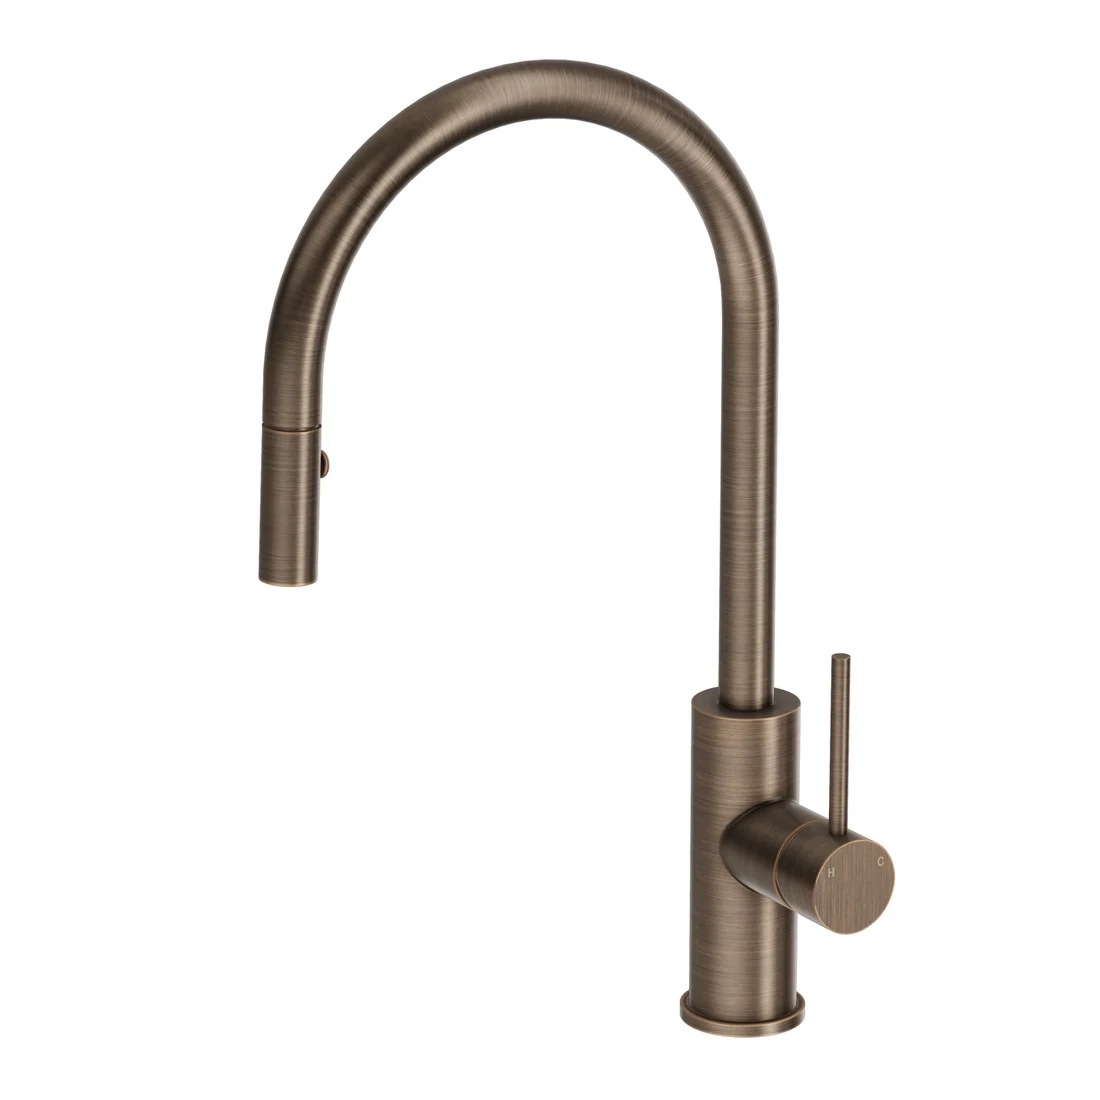
RainCo sells designer tapware and hardware, antique brass, matte black, gunmetal, across the Haven, Sereno and Lombardy ranges, with an average order near A$600.
Beautiful product with real demand. But at roughly A$5,000 a month, growth was stuck, and the reason was not the range. It was that nobody could say who the real customer actually was.
There was no defined persona to build around, no read on which finishes actually carried the business, and no way to point marketing at the buyers most likely to convert. Every dollar was a guess against a flat catalogue, and a flat catalogue hides the one or two things that are really driving the revenue.
Let the data name the customer and the hero product.
Before anything was spent, the work went into the data RainCo already had, orders, products and customers, to answer two questions the business had never had answered: who is actually buying, and what are they actually buying.
The order data pointed at one persona: renovators in higher-income areas. Average order above A$600 on tapware alone, whole-house fit-outs running A$3,000 to A$4,000+, split between full renovations and single-room upgrades. With the buyer defined, range, message and targeting could be built for a real person instead of guessed at.
Product and sales data showed a single finish, antique brass, carried around 85% of revenue. Nobody had quantified the concentration. Rather than keep spreading thin across every finish, we concentrated growth behind the proven winner and rode it past A$100k a month.
A business leaning that hard on one finish is fragile. Past A$100k a month, the analytics guided a deliberate move into the other finishes, brushed nickel, gun metal and matte black, while tracking the concentration coming down against a safe ceiling. The business kept growing without betting everything on a single SKU.
34x monthly revenue, on a business that no longer rests on one SKU.
Over eight months, monthly revenue climbed from A$5,000 to A$170,000, a 34x increase, built on the customer and the product the data proved out. And because the same analytics guided a deliberate diversification past A$100k a month, the brand reached that scale without resting on a single finish.
The compounding came from the structure, not a single tactic. The data named the customer, surfaced the product carrying the business, and then de-risked the concentration as revenue scaled. The outcome was a brand that grew 34-fold without growing itself into a single point of failure.