Find and keep your best customers.
The first sale is the expensive one. The money is made on the second, the third and the tenth. Blufire shows you which customers come back, how much margin they throw off over time, and where the lifecycle is quietly leaking the ones worth keeping.
Grow lifetime value and cut churn. The second order is the inflection.
Acquisition gets all the attention, but the unit economics are decided after the first order. A customer who never returns barely pays back the cost of winning them; a customer who comes back two or three times is where the margin lives. The whole job is moving people across the one line that matters most, from one order to two, and then keeping the curve climbing. Most stores cannot see that line cleanly, so they keep buying first orders and quietly losing the customers who were worth keeping.
See who comes back, who is worth keeping, and what moves the curve.
Watch lifetime value build by cohort
Group customers by the month they first bought, then track the contribution margin each cohort throws off as it ages. You see whether recent cohorts are worth more or less than older ones, long before it shows up in the headline numbers.
Read the shape of your retention curve
Every store's repeat behaviour falls into one of three shapes. A declining curve keeps losing ground. A flattening curve settles onto a loyal base. A smiling curve turns back up as your best customers buy more. Blufire tells you which one you have, because the shape decides the strategy.
Time the window to the second order
Repeat customers do not return on an even schedule. The bulk of second orders land fast, then a long tail trickles in for months. Knowing exactly when that window opens tells you when a winback is still worth the spend, and when a customer has effectively gone.
Rank your best customers by true margin
Score every customer on recency, frequency and the contribution margin they keep, then sort. Your top segment is rarely your highest spenders; it is the people who come back, at full price, on the products that pay. Protect them, and acquire more like them.
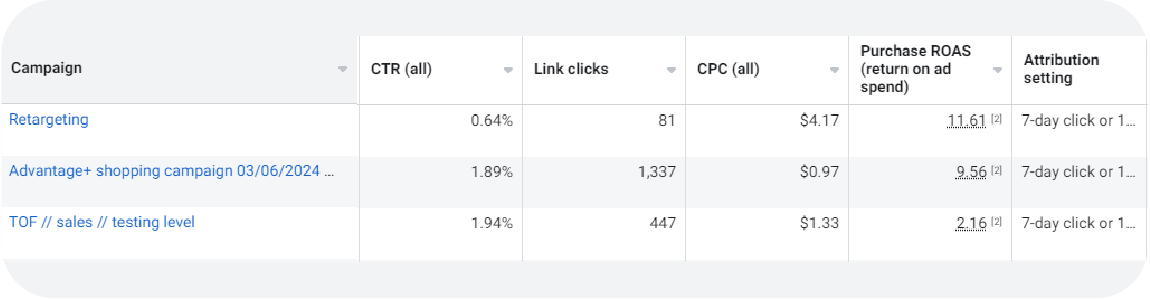
Credit your owned channels for the LTV they build
Email and SMS do their work over weeks, not on the last click. Blufire's own attribution credits owned lifecycle for the repeat margin it actually drives across the customer's life, so you can see what your flows are worth and where the next flow should go.
Channel and lifecycle contribution is powered by Blufire attribution, never a last-touch guess from your store, and unlocks as your own attribution is connected.
The surfaces that do the job.
The decisions you can finally make.
Protect the customers who pay
Identify your champion and loyal segments by true margin and give them the attention, offers and stock they earn, before they drift.
Win the second order on time
Concentrate post-purchase effort inside the window when repeat orders actually arrive, instead of mailing everyone forever.
Buy more of your best
Feed the segments with the strongest cohort LTV back into acquisition, so the next first order is more likely to become a second.
Retention thinking, in the numbers.
Real Blufire engagements where seeing the repeat curve, and the customers behind it, changed where the money went.

Built for operators who grow by keeping customers.
The retention core of Margin OS: cohort LTV, the repeat curve, RFM segments and owned-channel lifecycle, all denominated in true contribution margin. Go deeper in the Retention & LTV Playbook.
Repeat and referral value per customer and per region, so account effort flows to the relationships that keep paying. See the Retention & Lifecycle Benchmark.
Revenue tells you what sold. Margin tells you what made money. Blufire shows you exactly where profit leaks across products, channels and customers, and the move that fixes it.
A promotion can lift revenue and still leave you worse off. Blufire shows the true contribution-margin impact of every discount and return, so you cap the offers that quietly eat profit and keep the ones that earn their place.
Weather and seasonality move demand long before your sales report shows it. Blufire reads the degree-day signal 30 to 45 days ahead, so you place spend into in-season demand instead of chasing it after the peak has passed.