Problems we solve / The marketing / Fatigued creative
Problem 12 of 16 · The marketingWhich ad creative is fatigued and quietly bleeding spend?
Ad fatigue rarely announces itself. The ad that carried last month keeps its budget, the platform keeps reporting a respectable ROAS, and the margin it earns slides a little every week. By the time the dashboard turns red, the spend is gone.
Rank every creative on the CM1 it earns per dollar of spend, week by week, not on the ROAS the platform reports. A fatigued ad is one whose margin return is falling while its spend holds, and Blufire's Creative Analytics section flags it on the Fatigue Board and queues its replacement.
5.0 on Google · 100+ businesses · $153M revenue influenced
One ad, six weeks, same budget.
A single ad on A$2,000 a week. Average order A$100, CM1 of A$40 per order, so each order returns 40% of its revenue as margin before shipping and fees.
The platform says 2.6x, which sits above the 2.5x break-even ROAS that a 40% CM1 sets (1 ÷ 0.40). The ad looks safe. On the orders it really drove, it returned 1.9x and lost A$480 of margin in week 6 alone, before shipping and payment fees.
The signal was there from week 4, when CM1 per dollar of spend fell from 1.60x to 1.10x on a flat budget. That is the moment to brief the replacement, not week 6. Check your own threshold with the break-even ROAS calculator.
The platform measures the ad on revenue it claims, not margin it makes.
Every ad wears out. The same people see it again, the hook stops stopping them, and each extra impression buys fewer real orders. The cost per result creeps up slowly enough that no single week looks alarming.
The platform's own number hides the decline for longer than it should. Overlapping attribution windows let one sale show up in several dashboards, and view-through credit keeps a tired ad looking busy (see platform over-claiming). A falling creative can hold a steady reported ROAS while the orders it genuinely drives drop away.
Revenue is also the wrong yardstick. Two ads with the same ROAS can sell very different products: one moves full-price, high-margin lines and the other moves a discounted bundle. Judge them on contribution margin and the ranking often flips, and so does the list of ads worth refreshing.
Every asset ranked by the margin it earns, and a queue for what replaces it.
Section S10, Creative Analytics, ranks every ad asset on CM1 rather than platform ROAS, then watches each one for decay. When an earner starts to fade, it moves onto the Fatigue Board before it burns budget, and the Refresh Queue orders what to replace next.
The screen below is the attribute ranking: every hook (or offer, CTA style, visual style, media type) ranked by CM1-ROAS next to its spend, click-through rate, CPM and a fatigue bar. It is how the next brief starts from what the earners share, instead of from taste.
- Creative LeaderboardEvery asset ranked by the CM1 it earns, not the ROAS the platform reports.
- Fatigue BoardCatches decay in an asset's margin return before it burns more budget.
- Refresh QueueOrders the fatigued assets by what to replace next, worked straight off the board.
- Winning AttributesShows what the earners have in common: hook, offer, format and the rest.
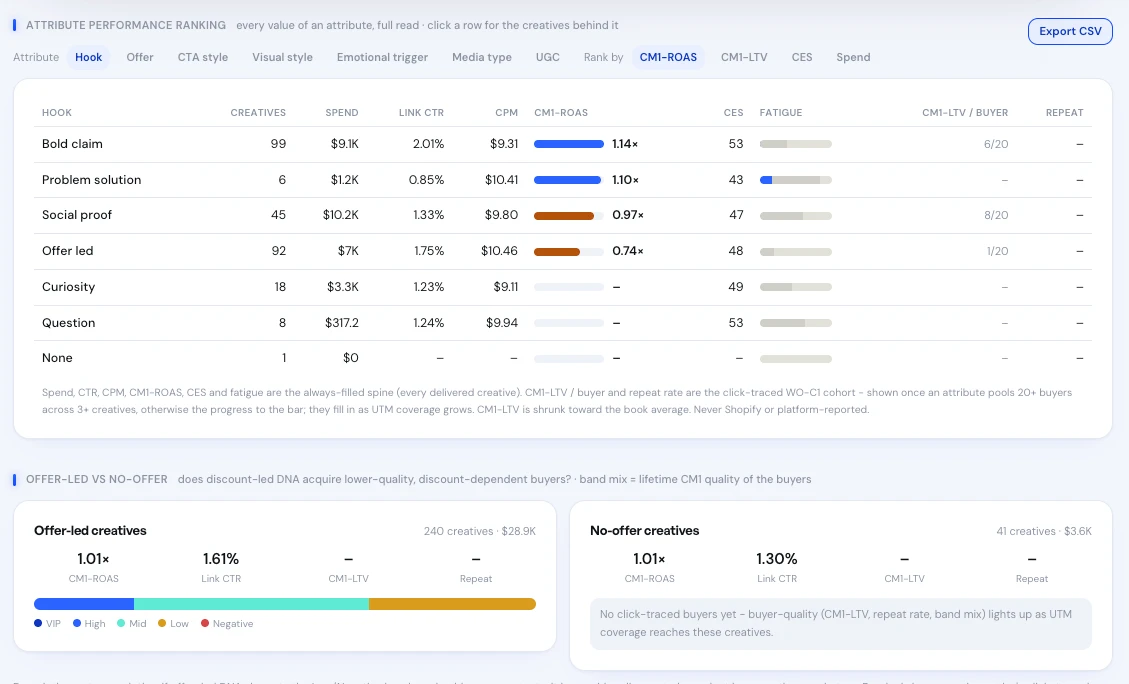
Real product screen, shown on sample data.
The team behind the numbers.
“Quick to take action, and bring a lot of experience… a partner who can strategically execute and adapt to fast-paced industries.”















A weekly ad fatigue routine that holds up.
- Read the trend, not the week.One soft week is noise. Two or three weeks of falling CM1 per dollar on a steady budget is fatigue.
- Hold spend steady when you judge decay.A drop in return after a budget increase may be saturation, not fatigue. The marginal CAC tells them apart.
- Brief the replacement before you pause.Have the next asset ready when the board flags one, so the ad set is never left starved of creative.
- Refresh the element that wore out.Often the hook is tired and the offer is fine. Swap the attribute that stopped earning and keep the ones that still do.
- Check which products the ad sells.An ad pulling discounted or low-margin lines can look healthy on revenue. Read it against which channel is actually profitable.
The decision you walk away with.
Ads are paused when platform ROAS finally drops, weeks after the margin did.
The Fatigue Board flags an asset when its CM1 return starts to fall on steady spend.
The best ad is the one with the highest reported ROAS.
The Creative Leaderboard ranks on CM1, so a high-margin earner outranks a busy discount ad.
Refreshes happen when someone has time, in no particular order.
The Refresh Queue says which asset to replace first.
The next brief copies whatever the team liked last time.
Winning Attributes shows which hooks, offers and formats actually earn margin.