Divide what the platforms claim by what the store took.
You need two numbers for the same period: each platform's reported revenue, and the net revenue in your Shopify ledger. The ledger is the anchor because it cannot double-count.
| Term | What it means |
|---|---|
| Σ platform-reported revenue | Meta, Google, Klaviyo and any other channel's attributed revenue for the period, added together as reported. |
| Ledger revenue | Net revenue from real orders in Shopify, after refunds. Every order appears once. |
| Phantom revenue | Σ platform-reported revenue minus ledger revenue: the dollars that exist only because two dashboards booked the same order. |
The mechanism is overlapping windows. Meta's default counts a sale up to 7 days after a click and 1 day after a view; Google counts up to 30 days after a click; Klaviyo applies its own click and open window. A buyer who saw a Meta video, clicked a Google ad and then an email is one order and three conversions. Each platform is following its own attribution model, and none is wrong by its own rules.
Scaled across an account, the overlap is large. Measured documents ad platforms collectively claiming credit for up to 140% of actual revenue (Measured, 2024), and Varos benchmarking puts Meta roughly 26% above third-party analytics and Google Ads 15% to 20% high under modelled conversions (Varos industry benchmark, 2024), both as cited on The Math.
One month of claims held against 2,000 real orders.
A store banks A$180,000 from 2,000 Shopify orders at an A$90 average. Here is what each platform reports for the same month.
| Source | Conversions | Revenue claimed | Share of ledger revenue |
|---|---|---|---|
| Meta Ads | 1,150 | A$103,500 | 57.5% |
| Google Ads | 820 | A$73,800 | 41.0% |
| Klaviyo | 690 | A$62,100 | 34.5% |
| Sum of platform claims | 2,660 | A$239,400 | 133.0% |
| Shopify ledger | 2,000 | A$180,000 | 100.0% |
Demonstrative numbers, sized inside the published ranges. The true overlap is larger than 660 orders, because some of the 2,000 orders came from organic search or direct visits that no platform claimed at all.
The summed ROAS is fiction. The ledger ratio is not.
Same store, same month. Paid spend is A$30,000 on Meta and A$18,000 on Google.
If this store's margin before marketing is 35%, its break-even ROAS is 2.86x. Meta's reported 3.45x clears it comfortably. The deflated 2.74x does not. The same campaign is a scale candidate on the dashboard and a loss on the ledger.
Treat the 26% as a starting assumption, not your number: it is an average across accounts. Your own ratio comes from reconciling order IDs, and the cause question, whether the sale needed the ad at all, only a holdout test answers.
Every claim reconciled to an order that exists.
Section S5, Acquisition, runs the attribution models side by side instead of trusting one, and Margin Triangulation checks each model's claims against the margin that actually arrived. What gets published is one Canonical Source Map, a first-purchase source per customer that every other section reads.
Underneath, each customer journey shows every captured touch and the share of credit it earns under the chosen model, so one order's value is split across its touches rather than claimed in full by each.
- Model Comparison MatrixAttribution models compared side by side, so the gaps between them become information.
- Margin TriangulationModel claims checked against the contribution margin that actually landed.
- Canonical Source MapOne published source per customer, read by every other section.
- JourneysEach order's real path, every touch credited under the chosen model.
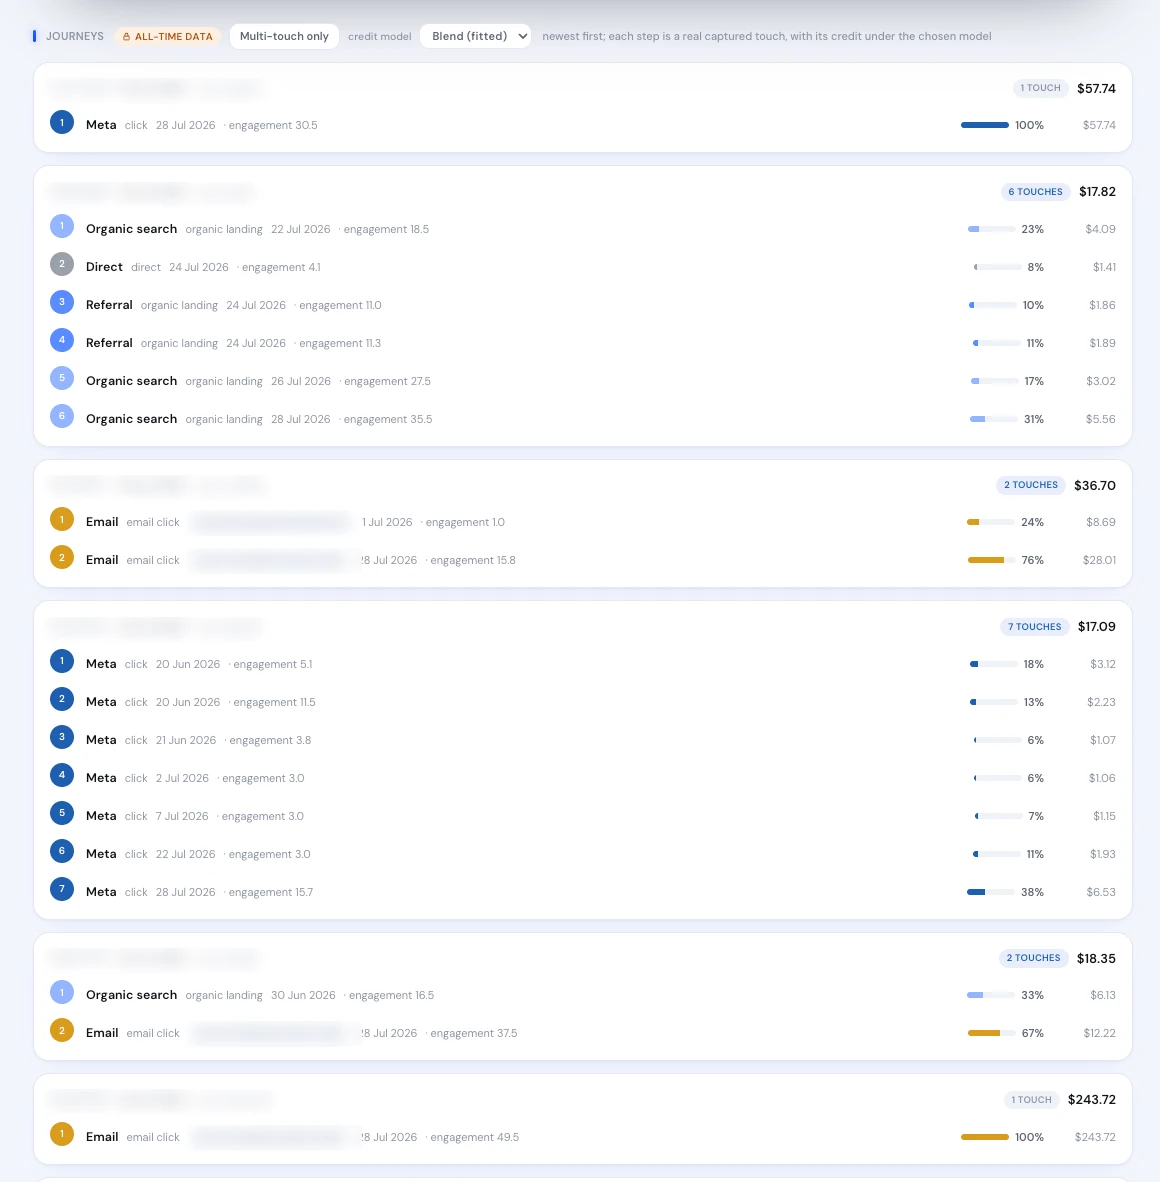
Real product screen, shown on sample data.
How over-claiming slips into budget decisions.
- Adding the dashboards together.Summed platform revenue is not a total. Use MER on ledger revenue for the account-wide read; it cannot double-count.
- Comparing channels on their own ROAS.Each platform grades its own homework with its own window, so a view-through-heavy channel looks better than it is. Compare on one model, read against the ledger.
- Deflating every channel by the same amount.Published averages differ by platform, and your account will differ again. Reconcile per channel.
- Treating reconciliation as proof of cause.Removing double counts leaves sales that would have happened anyway. The Math cites branded search at 60% to 80% non-incremental (Measured, 2024). Test with a geo-lift or holdout.
“I couldn't be more impressed with the Blufire team and the improvements they have made… working on the account and maximising results daily.”
 A$942kin incremental revenue once the double-counted attribution was fixedRead the case study →
5.0 on Google · 100+ businesses · $153M revenue influenced