Problems we solve / The marketing / The profitable channel
Problem 10 of 16 · The marketingWhich channel is actually profitable once real margin is counted?
Every channel report ranks by ROAS, and ROAS counts revenue. Two channels on the same ROAS can sell different products, at different discounts, to customers who never come back. The marketing efficiency ratio read on contribution margin, not revenue, is what tells you which one actually makes you money.
Price every channel in CM1-MER, contribution margin earned over spend, rather than platform ROAS. Blufire's Channels section does that in the Channel Master Table, and per-source customer profiles show what each channel's buyers become after their first order.
5.0 on Google · 100+ businesses · $153M revenue influenced
ROAS counts revenue. Channels differ in what that revenue is made of.
A dollar of revenue from one channel is not a dollar from another. Google Shopping might sell your high-margin hero product at full price while Meta sells a low-margin bundle through a first-order code. Both dashboards report revenue, so both show a healthy ROAS, and neither knows what the order cost you to make, ship and discount.
The Math shows how wide the gap gets. Break-even ROAS is 1 ÷ contribution margin, so at a 25% margin you need 4.0x just to cover variable cost, and at 70% you need 1.43x. A 4x ROAS on a 25% margin is a slow-motion loss; a 2.6x ROAS on a 70% margin is a thriving business. A channel report ranked by ROAS cannot tell those apart.
Then comes the second order. A channel that acquires one-and-done discount buyers looks cheap on day one and dear by month six; one whose customers reorder at full price does the reverse. First-order ROAS hides what margin LTV shows.
Same ROAS, same spend, opposite verdict.
Two channels each spend A$10,000 in a month and each report 3.5x ROAS, so both bring in A$35,000 of revenue. What differs is the margin on what they sell: 45% before ad spend for Channel A, 25% for Channel B.
On the dashboard the two channels are twins. On margin, Channel A brings back about A$1.58 of contribution for every dollar spent (A$15,750 ÷ A$10,000) and Channel B brings back A$0.88 (A$8,750 ÷ A$10,000). Channel B's break-even ROAS is 4.0x (1 ÷ 0.25), so at 3.5x every dollar it spends loses money. Channel A breaks even at about 2.2x (1 ÷ 0.45).
Contribution over spend is the idea behind CM1-MER. Shifting budget from B to A adds margin only while A's efficiency holds, and the next dollar in any channel usually costs more than the average: see marginal CAC. Set a margin-safe target with the target MER calculator.
Every channel priced in margin, and in what its customers become.
Section S6, Channels, reads every source in CM1-MER, contribution margin over spend, and decomposes blended CM1-MER into each channel's share. The Channel Master Table holds channel, customer and product in one view, so you see not only which channel earned margin but which products it sold to earn it.
Per-source customer profiles sit side by side: what each channel's new customers go on to buy and what they become after the first order. The SKU x channel matrix shows which products travel through which channels, credit-weighted from Blufire's own attribution rather than Shopify last touch.
- CM1-MERContribution margin over spend for every channel, with blended CM1-MER broken down into each channel's contribution.
- Channel Master TableChannel x customer x product in one view, so margin is traced to what was sold and who bought it.
- Per-source customer profilesWhat each channel's buyers become after the first order, compared side by side.
- SKU x channel matrixWhich products each channel sells and acquires customers on, in contribution margin, down to the SKU.
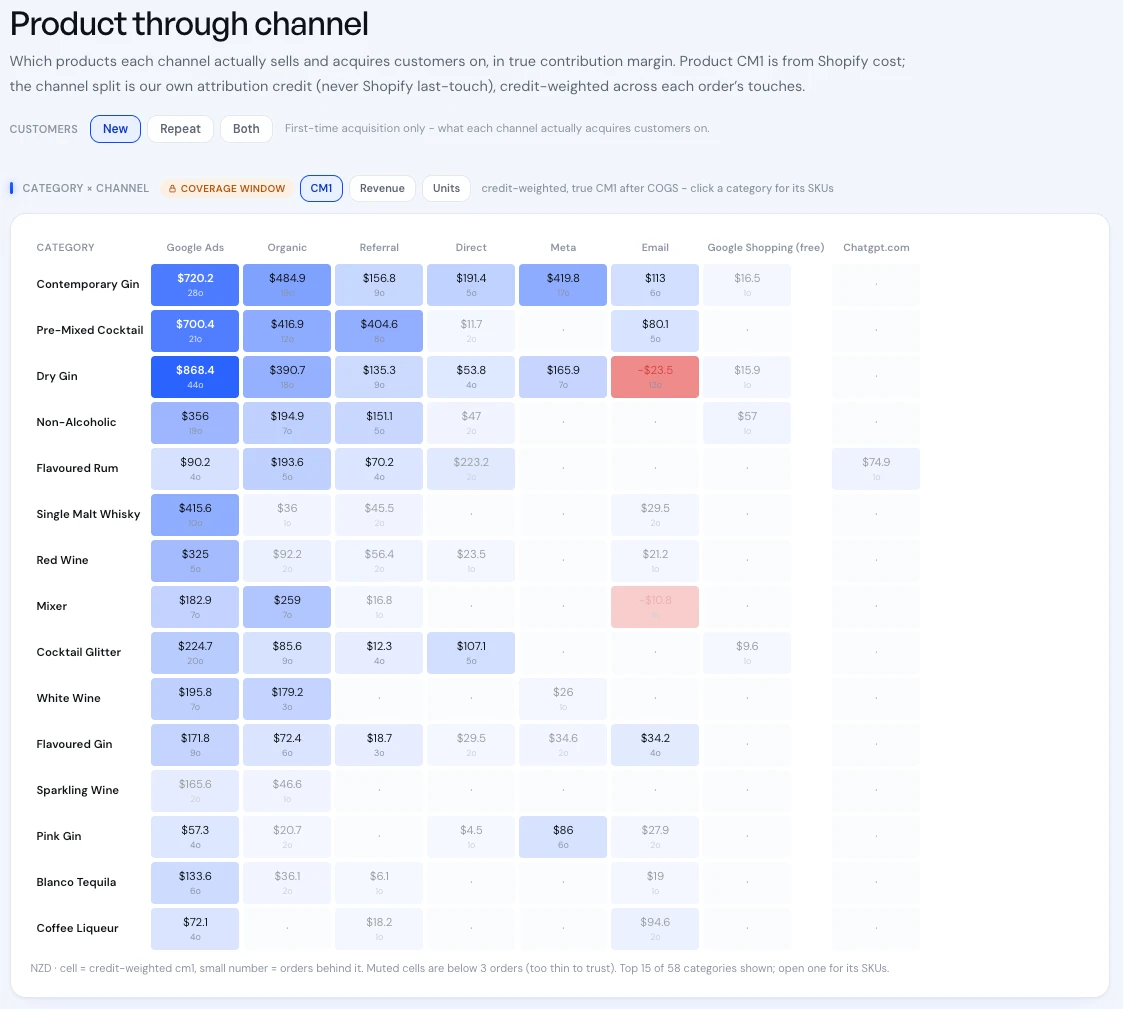
Real product screen, shown on sample data.
The team behind the numbers.
“Quick to take action, and bring a lot of experience… a partner who can strategically execute and adapt to fast-paced industries.”















The decision you walk away with.
Channels are ranked by platform ROAS.
Channels are ranked by CM1-MER: margin earned per dollar spent.
A 3.5x channel looks the same whether it sells hero products or clearance bundles.
The Channel Master Table shows which products each channel's margin came from.
A cheap first order counts as a cheap customer.
Per-source profiles show what each channel's customers are worth after the first order.
Next month's budget copies last month's split.
The next dollar goes where the margin maths says it earns most.
Where channel profitability usually gets misread.
- Using one break-even ROAS for the whole store.Each channel sells a different mix, so each has its own margin and its own break-even. See what is a good ROAS.
- Trusting each platform's own revenue.Platforms claim overlapping credit, so channel totals add up to more than you banked. Settle who gets the credit before comparing channels.
- Reading MER on revenue only.A revenue MER is a useful top-line check, but it cannot see a channel selling low-margin products. Read it on contribution margin.
- Stopping at the first order.Check CAC payback in margin, channel by channel. A dearer channel whose customers repeat can beat a cheaper one whose customers vanish.