What's Inside / The marketing / S10 Creative Analytics
Creative analytics that rank every ad by the margin it earns
Most creative analytics rank ads on click-through rate and the ROAS the platform reports. Both can hold up while an ad quietly starts buying cheaper, more discount-hungry customers. Section S10, Creative Analytics, ranks every asset on contribution margin and watches for decay before it burns budget.
Rank each asset by CM1-ROAS, the contribution margin it earns per dollar of spend, and track it week by week so fatigue shows up in margin before it shows up in the platform. Blufire's Creative Analytics section does both and queues what to replace next.
5.0 on Google · 100+ businesses · $153M revenue influenced
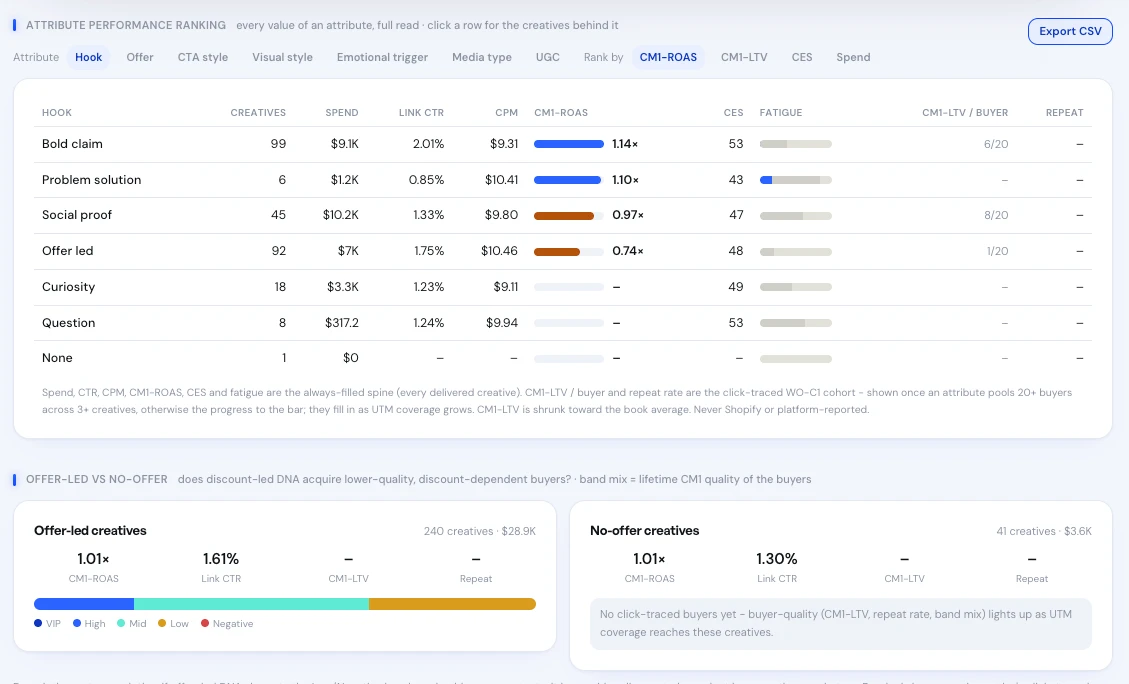
Real product screen, shown on sample data.
Section S10: every asset ranked by margin, decay caught early.
S10 reads every delivered creative with its spend, link CTR, CPM and the margin its buyers brought. The Creative Leaderboard ranks assets by CM1 rather than platform ROAS, and the Fatigue Board flags decay so the Refresh Queue can order what to replace next.
The attribute ranking in the screen breaks creative down by what it is made of: hook, offer, CTA style, visual style, emotional trigger, media type and UGC. Rank any of them by CM1-ROAS, CM1-LTV or spend. Beside it, an offer-led versus no-offer read asks whether discount-led creative acquires lower-quality, discount-dependent buyers. Where buyer data is still thin, the screen says so instead of filling the cell.
“…getting those visitors to convert into customers. They are hard workers… I highly recommend Brendan and the team.”
 A$5k to A$170ka month in eight months, with the finish carrying 85% of revenue de-riskedRead the case study →










For the people who brief, buy and approve creative.
Media buyers work the Refresh Queue straight off the Fatigue Board, so the replacement goes up before the decay shows in the platform. Creative strategists and designers use Winning Attributes to brief the next round from what earned margin, not from what looked good in a review. Audience-level briefs come from Persona Analytics, and S10 tells you which executions of them paid.
Founders and CMOs use the leaderboard to see whether the creative budget is funding assets that earn contribution margin or assets that only win clicks. Where a creative verdict needs proof of cause, ad-set holdouts run in Experiments.
Creative reporting today, and with S10.
Ads are ranked on CTR and platform ROAS.
Every asset is ranked by the CM1 it earns per dollar.
Fatigue is spotted when results have already collapsed.
The Fatigue Board flags decay early and the Refresh Queue orders the fix.
Briefs start from taste and last month's favourite.
Briefs start from the attributes the earning creatives share.
Offer-led ads look like winners on return alone.
Offer-led and no-offer creative are compared on the quality of the buyers they bring.
What S10 answers that an ads manager export does not.
- Which creative is fatigued and quietly bleeding spend?The core of the creative fatigue problem, read in margin rather than frequency alone.
- Which hooks and offers actually earn?Winning Attributes ranks each attribute value by CM1-ROAS, so a hook that wins clicks but loses margin is visible.
- Is offer-led creative buying the wrong customers?The offer-led versus no-offer read compares buyer quality, not just return, linking to discount dependency.
- Does platform spend match reality?Spend is reconciled before any ratio is calculated, so a CM1-ROAS rests on the right denominator.
One ad, four weeks, the same spend.
A$2,000 a week on one video. In week one it brings full-price buyers. By week four, fewer new people see it and more of its sales carry a code, so its CM1 share of revenue falls from 50% to 40%.
Against a 2.5x ROAS target, week four still passes. In margin, the ad has lost 44% of what it earned and now keeps A$0.12 per dollar before shipping and fees. Revenue fell 30%; margin fell faster because the mix moved to discounted buyers.
That gap is why fatigue should be read in CM1. Check your own threshold with the break-even ROAS calculator and see what is a good ROAS for why one target does not fit every margin.