Problems we solve / The operation / Reorder or clear
Problem 13 of 16 · The operationWhat do I reorder before it stocks out, and what do I clear before it goes dead?
Most stores have both problems at once: the best sellers run out while slow lines sit in the warehouse for months. The store-wide number looks fine because it averages the two together. The fix is to read cover SKU by SKU and turn it into a buy list.
Work out days of cover for every SKU and compare it with the supplier's lead time: anything with less cover than lead time needs ordering now, and anything carrying months more than it needs is capital to free. Blufire's Products / Inventory / Returns section does that per SKU and weights the buy list by margin.
5.0 on Google · 100+ businesses · $153M revenue influenced
One average hides two opposite problems.
Days inventory outstanding is usually reported for the whole store. It helps cash planning and does nothing for buying. A store-wide figure can be built from a hero SKU with three weeks of stock and a slow SKU with a year of it.
Reorders also follow habit: the purchase order goes out when the shelf looks low. By then the reorder point has usually passed, because the supplier's lead time was longer than the stock left.
The slow lines are harder to see. Nothing alerts you when a SKU stops selling. It ties up working capital that the best sellers need, and every month it waits, the discount needed to move it gets deeper. That is how stock becomes dead stock.
Days inventory outstanding, then the same idea per SKU.
| Term | What it means |
|---|---|
| Average inventory at cost | Opening plus closing stock value, at landed cost, divided by two. |
| COGS for the period | The landed cost of everything sold over the same period. |
| Days in the period | 365 for a year, 90 for a quarter. |
DIO is the inverse of inventory turnover: turning stock six times a year is about 61 days outstanding. For buying decisions, run the same idea per SKU as days of cover: units on hand divided by units sold per day.
Two SKUs, one reorder and one clearance.
SKU A is a best seller with a 35-day supplier lead time and a week of safety stock. SKU B is a slow line the buyer wants to hold at 60 days of cover.
SKU A crossed its reorder point 168 units ago (588 less 420), so even an order placed today arrives five days late. SKU B holds A$15,840 of cash in stock nobody is buying, cash that SKU A's next order could have used.
Averaged, the store looks healthy. Apart, there are two actions: order SKU A today and plan SKU B's clearance. The landed COGS calculator keeps the cost side honest.
A margin-weighted buy list, not another stock report.
Section S7 reads every SKU's sales rate, stock position and margin. Stockout Risk & Days-of-Cover flags what runs out and when, Overstock & Dead Stock flags the capital going stale, and Reorder & Open-to-Buy turns both into a buy list weighted by margin, so the cash goes first to the SKUs that earn the most.
The same section maps which SKUs pull each other into baskets. The screen here shows those pairs with their lift, co-orders and joint CM1, marked bundle-worthy only when the pair is jointly CM1-positive: one way to move a slow line alongside one that already sells, without a blanket markdown.
- Stockout Risk & Days-of-CoverFlags which SKUs run out, and when, so you reorder before the stockout rather than after.
- Overstock & Dead StockFlags the capital going stale on the shelf, SKU by SKU.
- Reorder & Open-to-BuyTurns stockout risk and overstock into a margin-weighted buy list.
- ABC x XYZ matrixPlaces every SKU by value and demand predictability, showing which deserve the working capital at all.
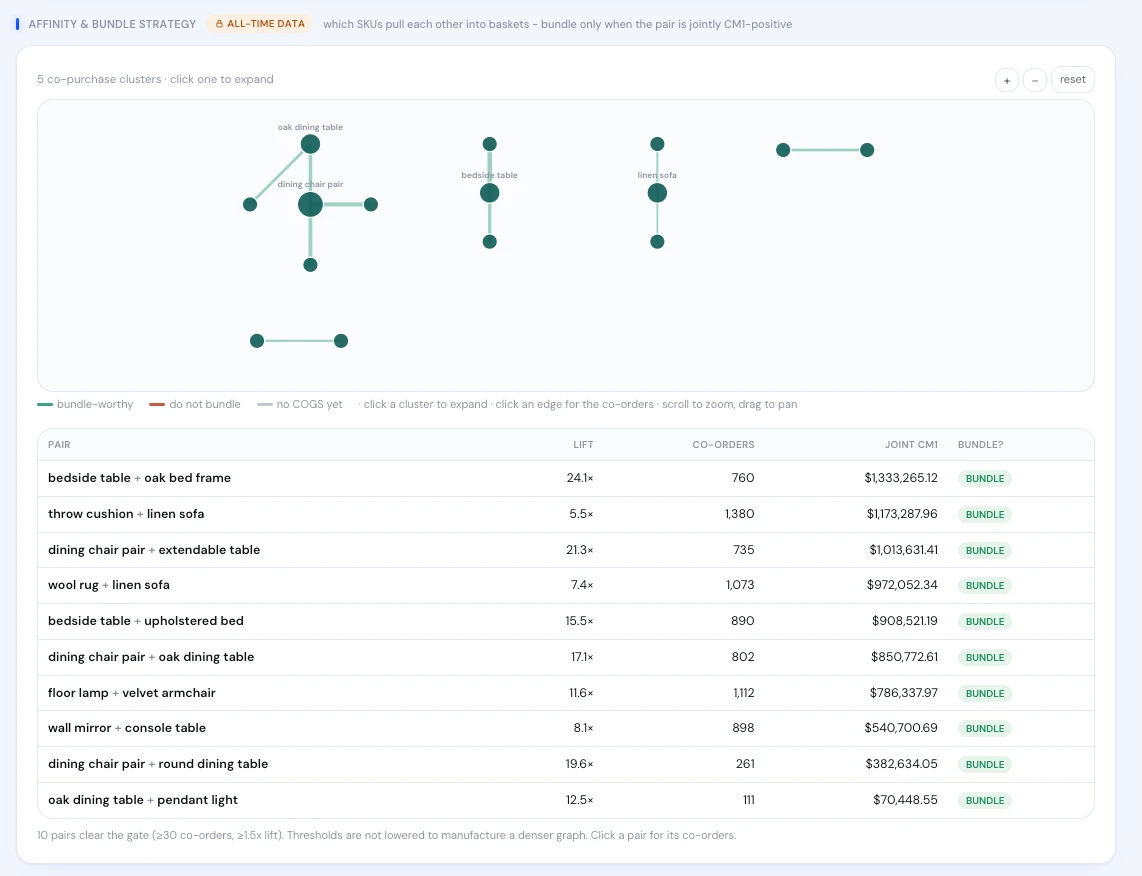
Real product screen, shown on sample data.
The team behind the numbers.
 A$0 to A$1Min under 12 months, in one of retail's most price-brutal categoriesRead the case study →
“My little secret weapon for my business. Highly recommend.”














The decision you walk away with.
One store-wide DIO figure that nobody buys from.
Days of cover per SKU, with the ones below lead time flagged.
Reorders placed when the shelf looks low.
Reorders placed at the reorder point, before the stockout.
Slow stock found at the annual stocktake.
Overstock and dead stock flagged while there is still time to sell it at a sensible price.
The buy budget split by habit or by last season's revenue.
Open-to-buy weighted by margin, so cash follows the SKUs that earn.
Where reorder and clearance decisions go wrong.
- Buying from the store-wide average.A healthy DIO can hide stockouts and dead stock at the same time. Buy SKU by SKU.
- Ignoring lead time.Cover only matters against how long the next delivery takes. Thirty days is plenty on a two-week lead time and too little on five.
- Treating every SKU the same.ABC analysis separates the few lines that carry the margin from the long tail. Protect the A lines first.
- Clearing too late.Every month a slow line waits, the markdown needed to move it grows. Decide early, while GMROI still has something to save.
- Planning buys without a forecast.Last season's sales miss trend and seasonality. Pair the buy list with a demand forecast.