Problems we solve / The operation / What returns cost
Problem 14 of 16 · The operationWhat are returns really costing us, and which orders will come back?
Most stores know their return rate. Far fewer know what a return costs, because the refund is only the visible part. The shipping both ways, the payment fees, the handling and the stock that cannot be resold all sit in different reports, and none of them is labelled "returns".
Cost each return on contribution margin, not on the refund: add the shipping and fees you never get back, the return label, the handling, and the landed cost of anything you cannot resell. Then read that cost by return reason and product, which is what Blufire's Products / Inventory / Returns section does, alongside a refund-risk score on every order.
5.0 on Google · 100+ businesses · $153M revenue influenced
The refund is counted. Everything around it is not.
When an order is refunded, Shopify reduces revenue and the order drops out of the sales report. It looks as if the sale simply never happened. It did happen, though: the order was picked, packed and shipped, the payment processor took its fee, and often an ad paid to win it. None of that comes back with the refund.
A flat return rate hides the rest. Returns arrive weeks after the sale, so a month that looks profitable at close can give margin back in the following month. And a store-wide rate blends products that almost never come back with products that come back constantly, for reasons that have nothing to do with each other.
Return reasons are where the fix lives. "Too small" points at a size guide. "Not as pictured" points at photography or copy. "Arrived damaged" points at packaging or the carrier. A return rate cannot tell you which one to fix first; reasons read in dollars can.
The decision you walk away with.
Returns are a percentage on the monthly report.
Returns are a dollar cost on contribution margin, including shipping, fees, handling and unsellable stock.
This month's margin is counted before its returns arrive.
Refund economics shows how much margin each cohort of orders gives back, and when.
Return reasons sit in a spreadsheet nobody costs.
Return Reasons ranks causes by product, so the fix starts where the money is.
High-risk orders look the same as every other order.
Refund-Risk Scoring flags them before the margin is treated as kept.
The full cost of one return.
An A$120 order with A$48 landed COGS, A$10 outbound shipping and A$4.60 payment fees. The customer returns it and gets a full refund.
The refund report shows A$120 of revenue lost and nothing else. The real result is a loss of A$35.60 on an order that would otherwise have contributed A$57.40, and a loss of A$83.60 if the product comes back unsellable. Any ad spend used to win the order is on top.
So two products with the same return rate can cost very different amounts, depending on shipping weight and whether the stock comes back resaleable. Put your own figures through the returns impact calculator.
Returns read in dollars, by reason, before the margin is counted as kept.
Section S7 reads refunds as cohort timing and dollars, not a flat rate, so you see how much margin each month's orders give back and how long it takes to arrive. The Return Reasons view shows why, product by product, so the fix lands on the cause.
Refund-Risk Scoring flags the orders and customers most likely to bounce back before that margin is counted as kept. The screen here is the CM1 waterfall that the rest of the product reads from, where refunds sit as their own line between list revenue and CM1.
- Refund economicsReturns read as cohort timing and dollars, not a flat percentage.
- Return ReasonsWhy products come back, product by product, costed so the biggest fix is obvious.
- Refund-Risk ScoringFlags the orders and customers most likely to come back before their margin is counted as kept.
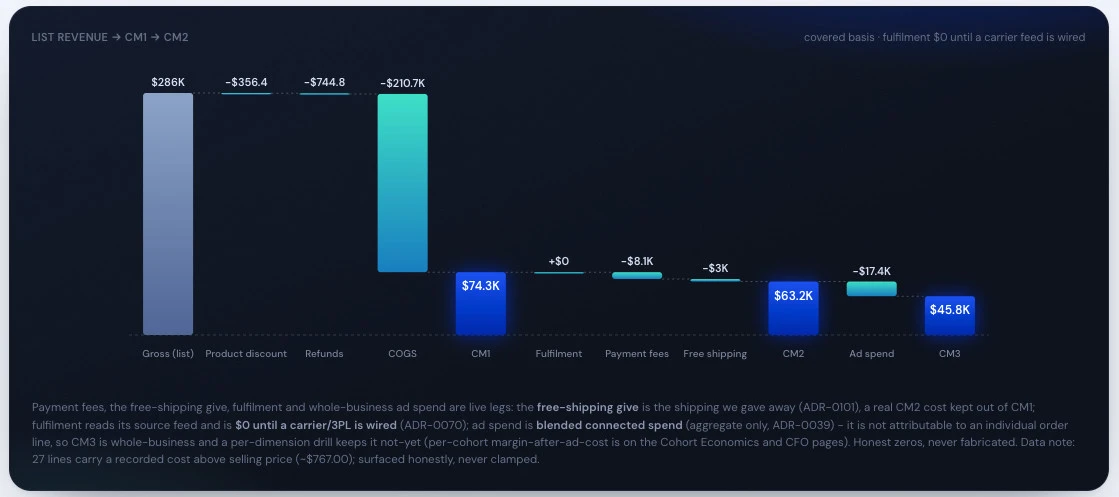
Real product screen, shown on sample data.
The team behind the numbers.
 A$5k to A$170ka month in eight months, with the finish carrying 85% of revenue de-riskedRead the case study →
“…getting those visitors to convert into customers. They are hard workers… I highly recommend Brendan and the team.”














Where returns analysis usually goes wrong.
- Costing a return as the refund.The refund is revenue reversed. The cost is everything spent around it, measured on contribution margin.
- Closing the month before returns land.A month's orders keep coming back for weeks. Read margin by order cohort, not by the calendar month a refund was paid.
- Fixing the store-wide rate.One or two products usually carry most of the cost. Fix them by reason instead of tightening policy for everyone.
- Leaving returns out of acquisition maths.A channel whose customers return more is less profitable than it looks. Read which channel is actually profitable after refunds, not before.
- Ignoring who returns.Some customers return far more than others. Their true value shows once returns are netted out, which is why some VIPs lose money.