Problems we solve / The operation / Did it cause margin
Problem 16 of 16 · The operationDid that campaign actually cause new margin, or would those sales have happened anyway?
Every dashboard can show which sales a campaign touched. None of them can show which sales it caused, because they never see the customers who were not advertised to. That comparison is the whole question, and the only way to get it is to run a test.
Hold the campaign back from a comparable group, a region or a slice of the audience, and measure the difference in contribution margin between the two. That difference, less the spend, is what the campaign caused. Blufire's Experiments section runs geo-lift tests and holdouts and returns each verdict with a confidence interval in CM1.
5.0 on Google · 100+ businesses · $153M revenue influenced
Attribution counts touches. It cannot count the sales that would have happened anyway.
An attribution model decides how to share credit for a sale among the ads a customer saw. It never asks whether the sale needed any of them. A customer who was always going to buy, and happened to click a branded search ad on the way, is credited to that ad in full.
The gap is large where intent already exists. Per the sources cited on The Math, branded search runs 60% to 80% non-incremental and retargeting 40% to 70%. In the eBay field experiment (Blake, Nosko and Tadelis, Econometrica 2015), almost all the paid clicks eBay gave up were immediately recaptured by organic results. And a documented Meta test cited on the same page showed 2.1x true incremental return against 4.8x platform-reported.
Incrementality testing closes the gap with a control group. Advertise to one group, hold back from a comparable one, and compare. Whatever the advertised group did beyond the control is what the campaign caused. Read that gap in margin, not revenue, and you know whether the campaign paid.
A six-week geo-lift test, read in CM1.
Paid social runs in a set of test regions and is held back in matched control regions. The control shows what the test regions would have earned without the ads.
The platform says 4.5x. The test says the ads caused A$24,000 of CM1 on A$20,000 of spend: a small gain at best. The interval runs from a A$6,000 loss to a A$14,000 gain, so this test cannot rule out that the campaign lost money.
That is still a useful answer. It says: do not scale this on the platform's number. Run it longer or add regions to narrow the interval, then decide. A test without an interval would have reported a clean A$4,000 win.
Tests designed, run and read in margin, with the evidence on record.
Section S13, Experiments, answers causally: geo-lift tests for paid media, email and SMS holdouts, and social ad-set holdouts, each returning a verdict with a confidence interval in CM1. Trustworthiness diagnostics sit beside every result, because an experiment you cannot trust is worse than no experiment.
The screen below is the test designer. You pick a test region, a matched control and the channel, and it shows the smallest CM1 lift the design can detect, how that improves with a longer window, and whether the control passes its match checks. A design too weak to find a realistic effect says so before you spend on it.
- Geo-lift testsPaid media switched on in test regions and held in matched controls, set up inside the section.
- Email and SMS holdoutsA slice of the list held back from a send or flow, so the true lift of owned channels is measured.
- Social ad-set holdoutsAn ad set held back from part of the audience to read its real lift.
- Confidence intervals in CM1Every verdict carries a range in contribution margin, not a single flattering number.
- Trustworthiness diagnosticsEvery test's history and checks kept on record beside its result.
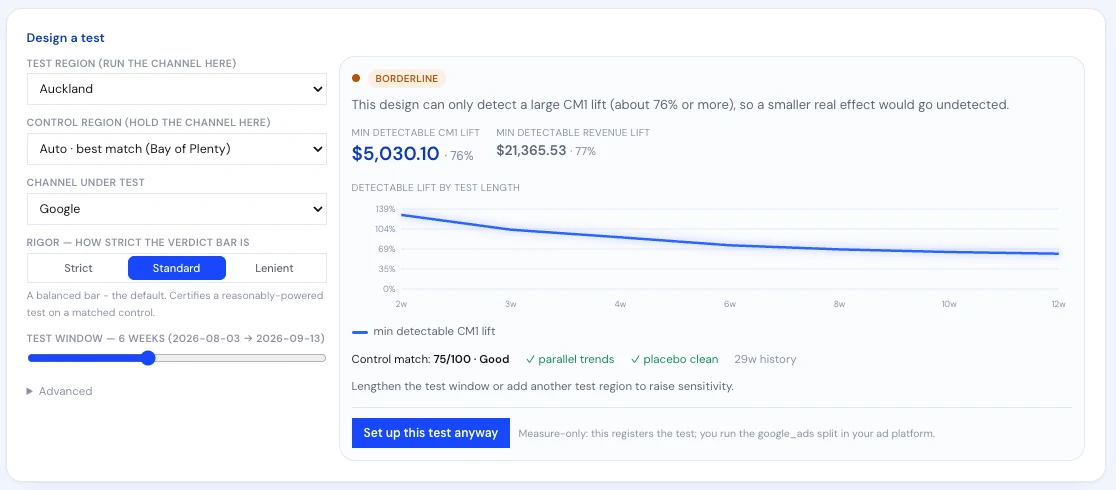
Real product screen, shown on sample data.
The team behind the numbers.
 A$942kin incremental revenue once the double-counted attribution was fixedRead the case study →
“I couldn't be more impressed with the Blufire team and the improvements they have made… working on the account and maximising results daily.”














The decision you walk away with.
Each platform reports its own ROAS and every campaign looks like it works.
Each tested campaign has a verdict on what it caused, in CM1.
Budget follows attributed revenue.
Budget follows incremental margin, with the interval in view.
Tests are run once, informally, and forgotten.
Every test's history and diagnostics stay on record.
A weak test gives a confident answer.
The designer shows what a test can detect before it runs.
Where incrementality testing usually goes wrong.
- Reading lift in revenue.A campaign can lift revenue and still lose money after spend. Read the lift in CM1.
- Running a test too small to detect anything.Check the minimum detectable lift first. If the realistic effect is smaller, lengthen the window or add regions.
- Ignoring the interval.A point estimate hides uncertainty. If the range crosses break-even, the honest verdict is "not proven yet".
- Testing the easy channels only.Branded search, retargeting and promos to loyal customers are where non-incremental sales hide. See which discount codes give margin away.
- Letting attribution overrule the test.Attribution shares credit; the test measures cause. Use the test to calibrate who gets the credit, not the other way round.