What's Inside / The operation / S7 Products / Inventory / Returns
Inventory turnover, stockouts and returns, read SKU by SKU in margin.
A catalogue-wide inventory turnover figure tells you how hard your stock works on average, not which SKU is about to run out, which has gone dead, or which hands its margin back as refunds. Section S7 reads all three per product, in contribution margin.
Read inventory turnover per SKU, not as one catalogue average, and read it next to days of cover and return cost. Blufire's Products / Inventory / Returns section does that on your Shopify data and ends in a margin-weighted buy list: what to reorder, what to clear and what to fix.
5.0 on Google · 100+ businesses · $153M revenue influenced
Real product screen, shown on sample data.
Which SKUs earn, which bleed, and what to buy next.
Products / Inventory / Returns is the section for the person who signs the purchase order. It takes every SKU, prices it in CM1 rather than revenue, and asks three questions of it: will it run out, will it sit, and will it come back. Every number drills straight to a buy list.
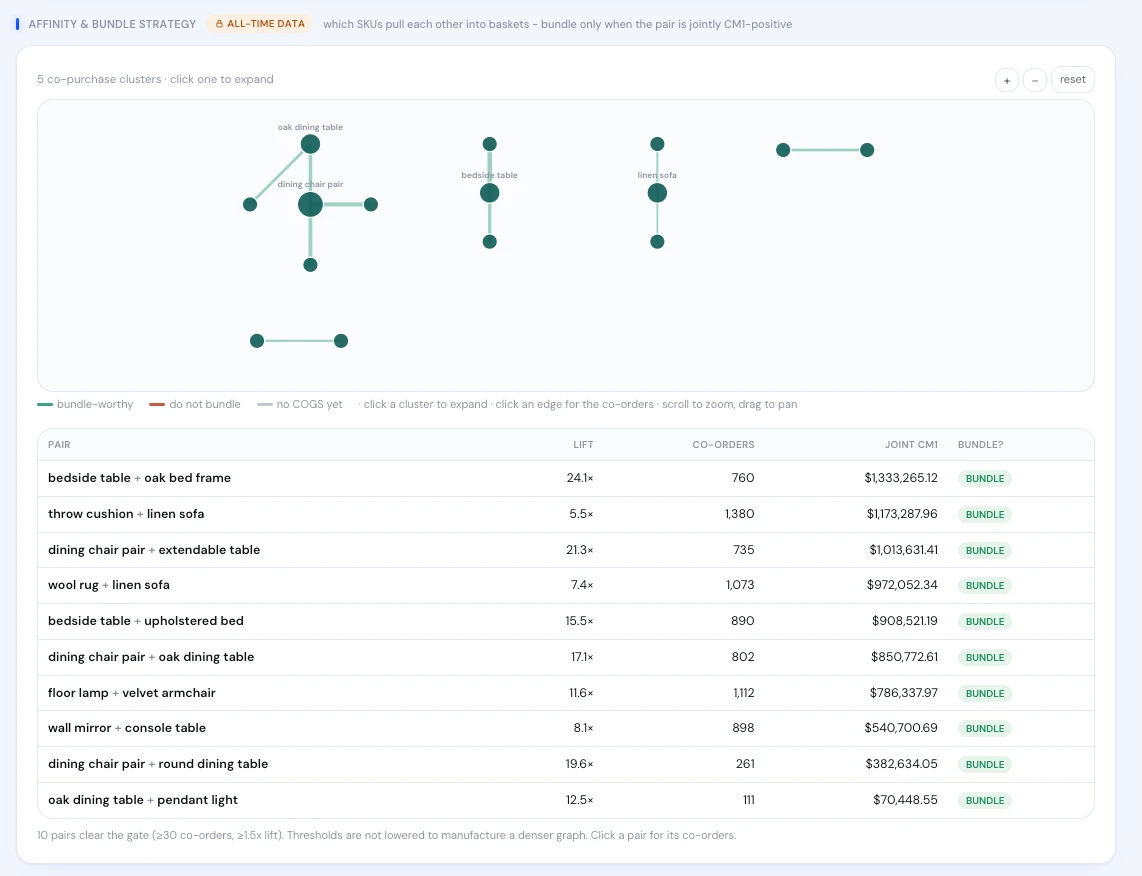
The screen shown is Affinity & Bundle Strategy. It clusters the products that pull each other into baskets, lists each pair with its lift, co-orders and joint CM1, and marks a pair bundle-worthy only when the two are jointly CM1-positive. Pairs have to clear a gate of at least 30 co-orders and 1.5x lift, and the thresholds are not lowered to make the graph look busier.
“…getting those visitors to convert into customers. They are hard workers… I highly recommend Brendan and the team.”
 A$5k to A$170ka month in eight months, with the finish carrying 85% of revenue de-riskedRead the case study →










The stock questions that decide the quarter.
- What do I reorder before it stocks out?Days of cover per SKU, against the rate it is actually selling. The full answer is on reorder or clear.
- What do I clear before it goes dead?Overstock and dead stock flagged while there is still time to sell it at a margin.
- What are returns really costing us?Refunds read in dollars and by reason, not as one flat rate. See the cost of returns.
- Which products belong together?Pairs that co-occur in baskets and still earn joint CM1 once bundled.
One catalogue average, two very different SKUs.
Inventory turnover is landed COGS divided by average inventory, both at cost. Here is a two-SKU store over one year.
A 3.0x turn looks respectable. Underneath it, 60% of the cash in stock sits in a product that moves 20% of the volume and holds more than a year of cover. That is the SKU the buy list should stop reordering and start clearing.
Turnover is speed only. A slow SKU on a rich margin can still earn its shelf space, which is why the Financial Models section tracks GMROI on the same data. Check what refunds do to the margin side in the returns impact calculator.
Built for whoever writes the purchase order.
Operations and buying teams live in the reorder view: days of cover, the stockout flags and the open-to-buy that turns them into quantities. The reorder point stops being a number in someone's head and becomes a line on a list.
Finance reads how much working capital is parked in stock that is not moving, and how much margin returns take back after the sale. Founders use the ABC x XYZ matrix to decide which lines deserve more depth and which should be cut.
Marketing uses the bundle pairs to see which products already sell together at a healthy joint margin. Every section reads the same CM1 math as Unit Economics, so a SKU that looks strong here cannot look weak there.
From a stock report to a buy list.
One inventory turnover number for the whole catalogue.
Turnover, days of cover and margin per SKU, with the laggards named.
Stockouts are found when the product page says sold out.
Stockout Risk flags the SKU while there is still time to reorder.
Dead stock is found at the end-of-year count.
Overstock & Dead Stock flags the capital going stale while it can still be cleared.
Returns are a single rate in the Shopify report.
Refund economics, return reasons and refund risk, product by product, in dollars.
Bundles are picked on gut feel.
Pairs are bundled only when they clear the co-order gate and stay jointly CM1-positive.