Problems we solve / The operation / Forecast and test the plan
Problem 15 of 16 · The operationWhat will next quarter look like, and can I test the plan before I commit to it?
Most quarterly plans are last year's numbers plus a growth percentage, agreed in a meeting and checked at the end of the quarter. The plan is a single line, nobody knows how wide the uncertainty is, and a big decision like a sitewide sale gets made before anyone has priced it.
Forecast revenue, CM1, demand and cash as a range, then run each big decision as a scenario against that forecast before you commit. Blufire's Planning & Forecasting section projects the quarter as forecast fans, prices a scenario in the Scenario Lab, and explains any miss with a CM1 variance waterfall.
5.0 on Google · 100+ businesses · $153M revenue influenced
Test a sitewide sale before it runs.
The base plan for the quarter is A$600,000 of revenue at A$270,000 landed COGS. The team proposes 10% off everything and expects units to rise 15%.
Revenue goes up A$21,000 and CM1 goes down A$19,500. The sale would hit the revenue target and miss the margin one. At 10% off, the base CM1 of 55% falls to 45% of the original price, so units must rise by 22.2% (0.55 ÷ 0.45) before the sale breaks even on margin.
Whether 15% or 25% is realistic is a question about price elasticity, which you can estimate from your own price history. Try the same test the other way with the price increase calculator.
A single-line plan cannot tell you how wrong it might be.
A forecast is an estimate, and estimates have a range. Next quarter depends on how many new customers arrive, how many existing ones come back, and how seasonal the category is. Draw that as one line and the plan looks certain. Draw it as a band and you can see how much could go either way, and plan stock and cash for the low end.
Most plans also forecast the wrong thing. Revenue is easy to project and says little about what you keep. A quarter that hits its revenue target with heavier discounting, or a worse product mix, can miss its contribution margin by a long way. Forecast CM1 alongside revenue, and cash alongside both.
The decisions inside the plan rarely get tested. A price rise, a sitewide sale or a COGS increase from a supplier each change units and margin together. The only way to know what they do to the quarter is to model them before they happen, which is what scenario analysis is for.
A forecast with a range, a lab to test the plan, and a waterfall for the miss.
Section S11, Planning & Forecasting, projects revenue, CM1, demand and cash as forecast fans. The screen here is the revenue fan: built from new and returning cohorts, with history joining the forecast at today and each month's share of returning revenue shown underneath. The Scenario Lab prices a COGS, AOV or discount change before you make it, and Plan-vs-Actual tracks the quarter with a CM1 variance waterfall, so a miss is explained, not just reported.
Behind it, section S12, Financial Models, runs the classic ecommerce models on your data, each showing its inputs, its formula and the records behind the answer.
- Forecast fansRevenue, CM1, demand and cash projected as a range, not a single line.
- Scenario LabStress-tests a COGS, AOV or discount move before you commit to it.
- Plan-vs-ActualTracks the quarter against plan with a CM1 variance waterfall that explains each gap.
- Cohort LTV, price elasticity, GMROIThe S12 models, run on your own data, with inputs and formula in view.
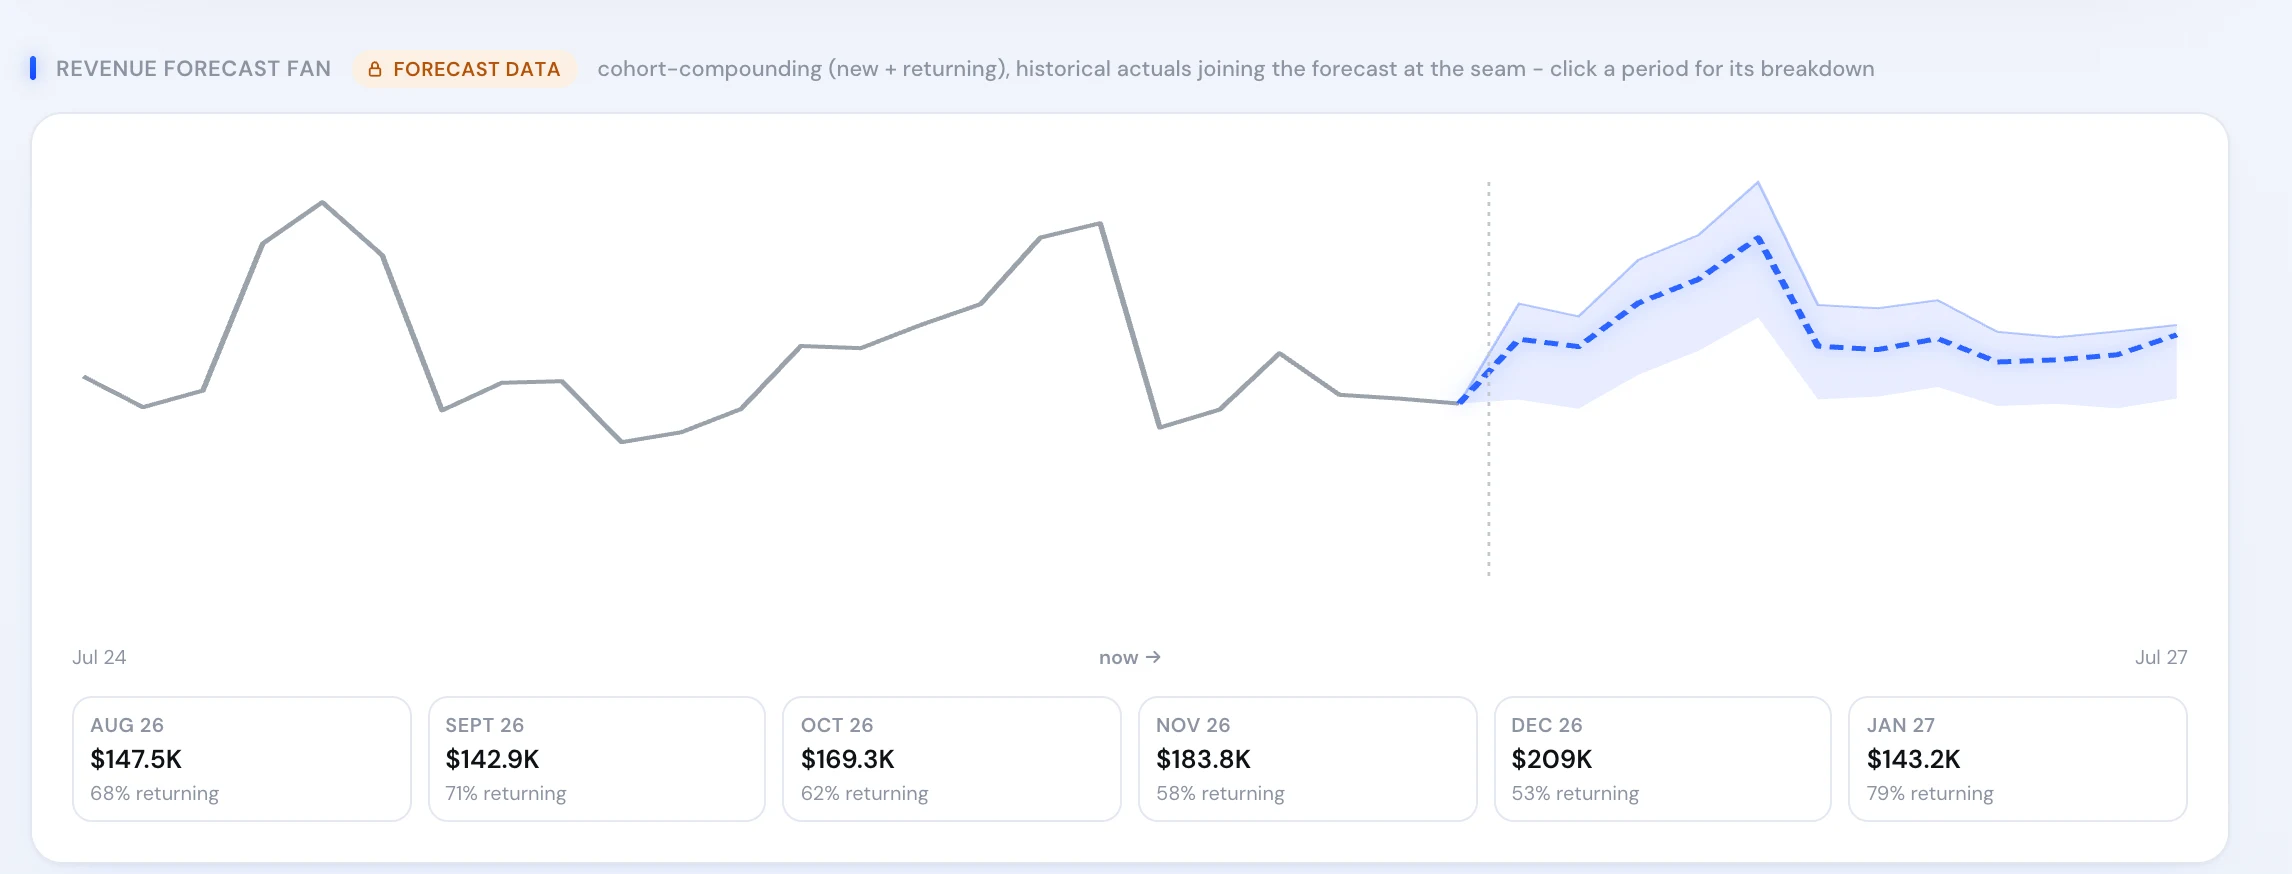
Real product screen, shown on sample data.
The team behind the numbers.
“They're experts in their field and genuinely seem to care about us winning… they achieve all the results we could hope for where it matters.”















Demand forecasting and scenario planning, in order.
- Split new from returning.Returning revenue comes from customers you already have and is far more predictable. Cohort analysis gives you that base.
- Plan for the band, not the midpoint.Buy stock and commit cash against the lower edge of the fan, and know what you would do at the upper one.
- Price every big decision as a scenario.Discounts, price moves and supplier cost changes all move units and margin together. Model both.
- Check the models behind the plan.Margin LTV sets what a new customer is worth; GMROI says which stock earns its place. See what to reorder or clear.
- Review the variance monthly.A miss explained in month one can be fixed. A miss found at quarter end can only be reported.
The decision you walk away with.
Next quarter is last year plus a growth percentage.
Next quarter is a forecast fan built from new and returning customers.
The plan targets revenue.
The plan carries CM1 and cash next to revenue.
The sitewide sale is approved because it grows sales.
The Scenario Lab shows what it does to CM1 before it is approved.
A miss is a number at the end of the quarter.
Plan-vs-Actual breaks the miss into its causes in a CM1 variance waterfall.