Problems we solve / The customers / VIPs who lose money
Problem 05 of 16 · The customersWhich customers look like VIPs but actually lose us money?
Your loyalty tiers and your RFM report both rank customers by how recently, how often and how much they spend. A customer who orders constantly, always on a code, and sends a third of it back sails to the top of that list. Net of discounts and returns, some cost you on every order.
Run RFM analysis with the M scored on contribution margin, not revenue: what each customer leaves after COGS, shipping, fees, discounts and returns. Blufire's margin-true RFM cube does exactly that, so the big spenders who only buy discounted drop out of the VIP cells and the quiet full-price regulars rise to where they belong.
5.0 on Google · 100+ businesses · $153M revenue influenced
Your VIP list is a spend list, and spend is not profit.
RFM segmentation scores recency, frequency and monetary value. The problem is the third: almost every RFM report and loyalty app fills the M with revenue, so it rewards whoever moves the most dollars through checkout, whatever it costs you.
Revenue hides the two costs that separate a good customer from an expensive one. Discounts come off the top of every order a code-hunter places, and returns hand back the sale while you keep the shipping, the handling and often a damaged unit. A customer can carry a high spend and a high order count while their contribution margin sits below zero.
Then the tier makes it worse. Loyalty programs answer high spend with deeper codes, early access and a concierge, so the perks flow to the customers already costing you the most. It is the same trap as discount codes that quietly give margin away, aimed at your best-known names. Meanwhile the full-price regular who never sends anything back sits halfway down the list, unrewarded.
The decision you walk away with.
The VIP tier is whoever spent the most last year.
The VIP cells hold the customers who left the most margin.
Negative-margin buyers get the deepest codes and earliest access.
The Discount-Dependency overlay flags them before the next perk goes out.
The quiet full-price regular never hears from you.
They surface near the top of the cube and get protected with full-price loyalty, not a code.
RFM is a quarterly export and a pivot table.
The cube reads every order, refund and code, and every cell drills to a list you can send.
Your top spender against a quiet regular, netted down.
Two customers over twelve months. Gross margin is after COGS, shipping and fees. Returns cost the margin on every order sent back.
By spend, the first customer is Platinum and the second barely registers. By margin, one costs you A$187 a year and the other makes you A$657: a swing of A$844, with the tier ranking them exactly backwards.
The fake VIP is expensive twice. Add the usual Platinum perk, say an extra 5% off everything, and that is another A$180 on A$3,600 of spend, taking them to −A$367.20. Standard RFM analysis never flags it, because nothing in the M column went down.
Net one of your VIPs against a quiet regular.
Enter each customer's annual revenue, gross margin, the share handed back as discount and their return rate, and it nets both down to true 12-month contribution and shows which one is really your best.
The customer with the higher spend is worth -A$187. The quieter one is worth A$657, a swing of A$844. Your loyalty program is probably rewarding the wrong one.
A simple net-down. Blufire scores every customer on true contribution and flags the fake VIPs automatically. Nothing you type here leaves your browser.
RFM analysis with the monetary axis scored in CM1.
Section S4, Customer Value, places every customer in a 12-segment RFM cube, from Champions and Loyal down to Hibernating, One and done and Lost, and lets you flip the monetary axis between revenue and CM1. Recency and frequency stay identical across both scorings, so any customer who changes cell when you flip is being carried by discounts or low margin.
Each cell shows the customer count, its share of total CM1 and its repeat rate, and every cell drills to the actual customer list.
- Margin-true RFM cubeEvery customer re-scored on the margin they leave, not the revenue they book, with a one-click revenue and CM1 toggle.
- Financial BucketsSeparates the profitable loyalists from the expensive lookalikes that a spend ranking lumps together.
- Discount-Dependency overlayShows which high-value cells are propped up by codes, so perks stop going to buyers who only purchase on discount.
- Drill to customer listAny number opens the customers behind it, ready to segment and act on.
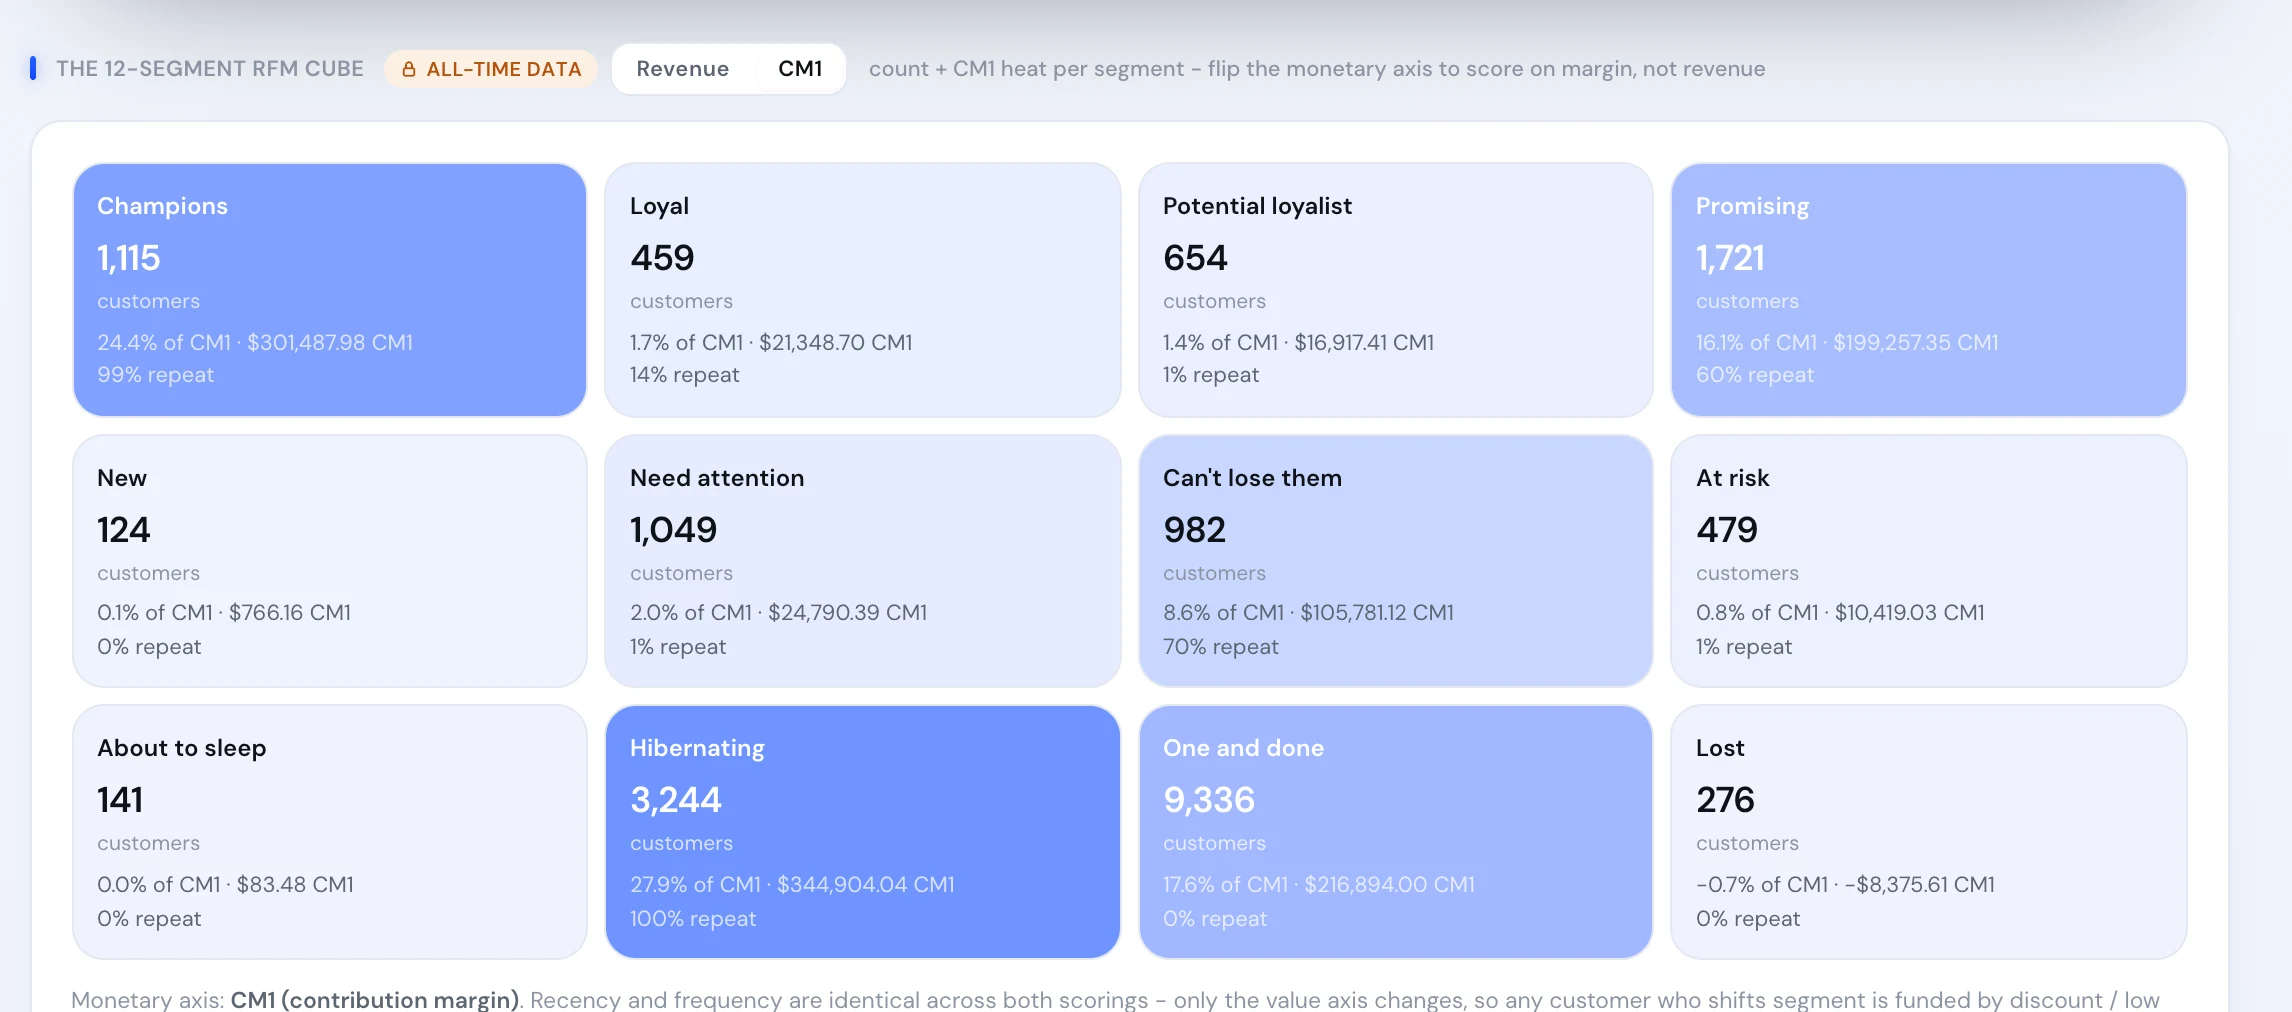
Real product screen, shown on sample data.
The team behind the numbers.
 A$942kin incremental revenue once the double-counted attribution was fixedRead the case study →
“They took the time to understand our business and goals, and delivered a clear, customised strategy that actually worked.”














Running RFM analysis on margin, by hand.
- Start from your top customers by spend.Take the names your loyalty tier or RFM report already puts at the top.
- Net out COGS, shipping and fees.Use landed COGS, not the supplier price, or every customer looks more profitable than they are.
- Subtract discounts and returns per customer.The codes they used and the margin lost on everything they sent back. The returns impact calculator shows how fast a high return rate eats a margin.
- Re-score the M, keep R and F.Rank on contribution instead of revenue and see who moves. Anyone who drops a band is being carried by discount or low margin. Carried over a lifetime, this is LTV on margin.
- Keep it current.Scores must update as orders, refunds and codes land, or the tier drifts back to spend.