Four inputs. The last one is the one most people skip.
| Term | What it means |
|---|---|
| AOV | Average order value: net revenue ÷ orders, after discounts and refunds. |
| Purchase frequency | Average orders per customer per year, measured on a cohort, not the whole base. |
| Customer lifespan | Average years a customer keeps buying. Cap it at a fixed window, such as 24 months, or a lapsed rule. |
| CM% | Contribution margin before marketing (CM2 on The Math): revenue less landed COGS, fulfilment, shipping and payment fees. Not gross margin, and not CM3, which already subtracts the ad spend you are about to weigh LTV against. |
Drop the last term and you have the common revenue formula for customer lifetime value. It is not wrong; it answers a different question. Revenue LTV says how much will move. Margin LTV says how much you can spend to win the customer and still come out ahead.
The same A$420 revenue LTV at four margins.
Holding AOV, frequency and lifespan fixed, here is what the customer is worth in margin and the CAC that still pays back inside 12 months (A$210 of first-year revenue × CM%).
| Contribution margin | Margin LTV | Max CAC for 12-month payback |
|---|---|---|
| 25% | A$105.00 | A$52.50 |
| 35% | A$147.00 | A$73.50 |
| 45% | A$189.00 | A$94.50 |
| 55% | A$231.00 | A$115.50 |
Demonstrative numbers. At a 35% margin, the A$110 CAC in the example is about 50% above the 12-month ceiling. Raising margin moves both columns; so does lifting frequency.
A 3.8x LTV:CAC that is really 1.3x.
A replenishment brand: A$70 average order, three orders a year, customers stay two years. Contribution margin before marketing is 35%, and new-customer CAC is A$110.
On revenue the customer looks worth nearly four times what they cost. In margin, the CAC eats three quarters of everything they leave behind (A$110 of A$147), and A$37 is all that remains for fixed costs and profit. Same customer, very different budget decision. Run your own with the margin LTV calculator.
CAC payback: when the margin actually comes back.
The Math judges margin LTV alongside a payback under 12 months. Same customer: A$70 × 3 orders ÷ 12 months is A$17.50 of revenue a month.
Revenue says the customer pays back in about six months. Margin says eighteen, well past a 12-month threshold, so this store is funding each new customer for a year and a half before seeing a dollar back. Check yours with the CM payback calculator.
Customer value in margin, for every cohort and the whole base.
Section S12, Financial Models, runs cohort LTV on your data and values the whole base as customer equity: the contribution margin customers have already produced, and what they are predicted to still generate, discounted to today. Each model shows its inputs, its formula and the records behind the answer.
It also shows how concentrated that value is, because the average customer describes almost nobody. Section S4 prices individual customers with survival curves and predicted CLV, and S2 tracks CM-payback per acquisition cohort.
- Cohort LTVLifetime value per acquisition cohort, run on your own order history.
- Customer equityBanked and forward contribution margin for the whole base, with the discount rate shown.
- Predicted CLVSurvival curves and BTYD-predicted value for each customer in the lifecycle board.
- Cohort economicsNew-customer CAC and CM-payback per cohort, in margin rather than revenue.
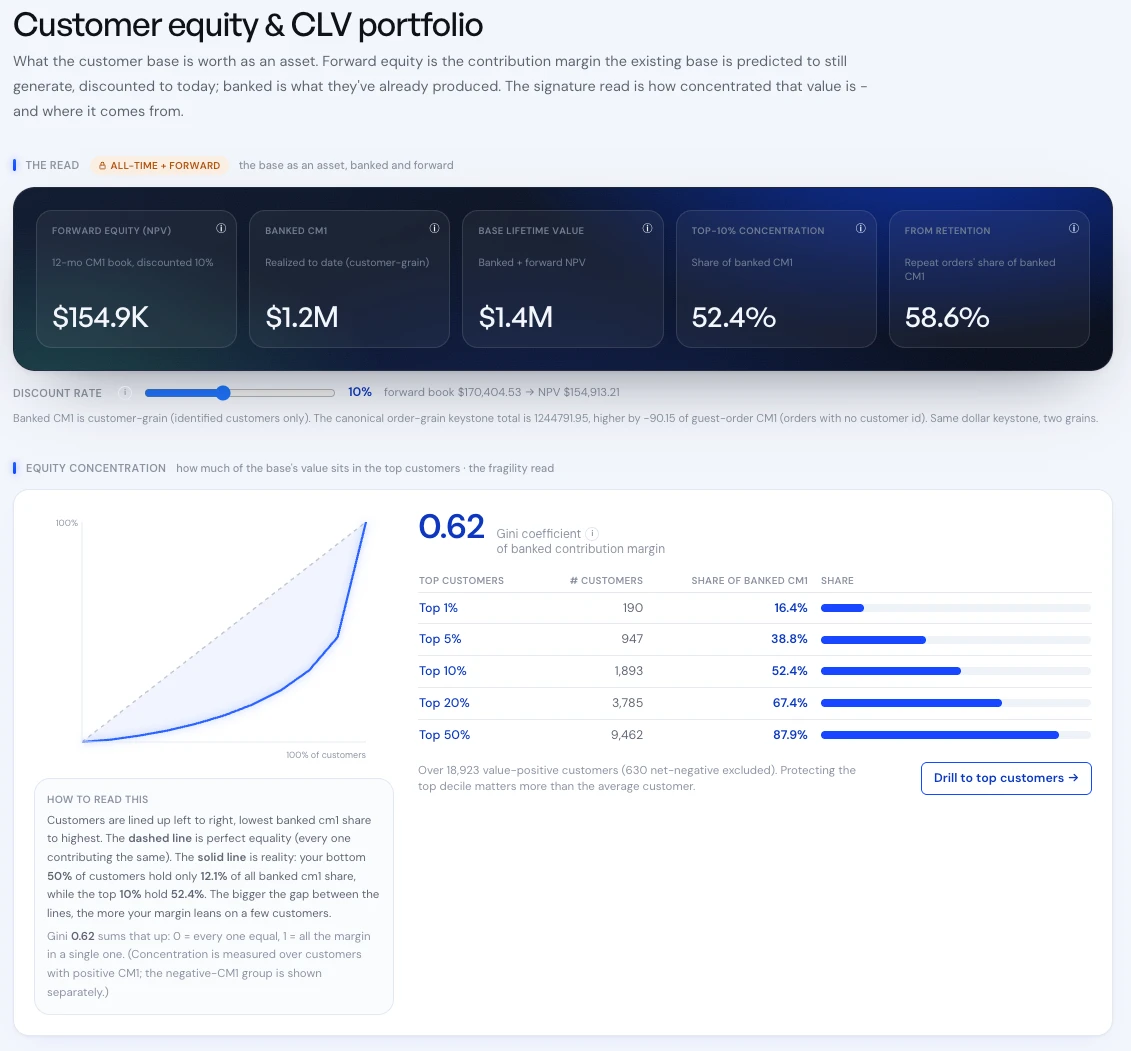
Real product screen, shown on sample data.
Why most LTV figures overstate.
- Spending against revenue LTV.At a 35% margin, a A$420 revenue LTV is A$147 you can actually deploy.
- One all-time average.Old loyal cohorts inflate it. Compute per acquisition cohort with cohort analysis.
- Unbounded lifespan.A projected tail ends up doing most of the work. Cap it at a window.
- Ignoring the clock.A healthy LTV:CAC ratio can still take years to arrive. Always read it next to payback, and see the three CACs for which CAC to divide by.
“They took the time to understand our business and goals, and delivered a clear, customised strategy that actually worked.”
 A$5k to A$170ka month in eight months, with the finish carrying 85% of revenue de-riskedRead the case study →
5.0 on Google · 100+ businesses · $153M revenue influenced