Problems we solve / The customers / First product that creates repeats
Problem 07 of 16 · The customersWhich first product turns a one-time buyer into a repeat customer?
Your product report ranks by revenue and unit margin, the profit on one sale. Neither can see what happens after that sale. Some products are front doors: the first thing a customer buys before they meet your core range. Rank those on the first order and you rank them backwards.
Split your repeat purchase rate by the product each customer bought first, then weight it by margin: the 12-month contribution of the customers each entry product brings in. Blufire's entry-category repeat scorecard does that across the catalogue, and the Entry Product x Channel matrix shows which channel sends those first orders.
5.0 on Google · 100+ businesses · $153M revenue influenced
Unit margin measures a transaction. It cannot measure a customer.
Almost every catalogue decision is made on revenue and unit margin: what to feature, what to discount, what to put ad spend behind, what to quietly discontinue. Both stop at the checkout, so a product whose buyer returns five times looks exactly like one whose buyer never comes back.
Your store-wide repeat purchase rate does not help, because it averages every entry point together. Shopify's cohort reports group customers by the month they first bought, not the product they bought, so the gateway and the dead end sit in the same cohort line and cancel each other out.
The cost shows up in two places. The thin-margin starter item lands on every "cut this" list, which quietly switches off your cheapest source of repeat customers. And acquisition spend goes behind the product with the fattest first order, which is often the one whose buyers never return, so your new-customer CAC never pays back.
Rank entry products on what their customers earn in a year.
The number you want is the 12-month contribution per customer a product acquires, not the margin on the product itself.
| Term | What it means |
|---|---|
| First-order CM | Revenue on the first order minus landed COGS, shipping and fees. |
| Repeat orders in 12 months | Average further orders per customer whose first order included this product. Zero means one and done. |
| CM per repeat order | Contribution on those later orders, usually your core range at a different margin to the entry product. |
Four entry products, ranked two ways.
Demonstrative numbers. Each row is the average customer whose first order was that product.
| Entry product | First-order CM | Repeat orders, 12 months | CM per repeat | 12-month CM |
|---|---|---|---|---|
| Premium hero | A$48.00 | 0.1 | A$48.00 | A$52.80 |
| Scented candle (A$40 at 55%) | A$22.00 | 0.2 | A$22.00 | A$26.40 |
| Starter kit (A$60 at 30%) | A$18.00 | 2.1 | A$23.40 | A$67.14 |
| Loss-leader bundle | A$9.00 | 3.0 | A$22.00 | A$75.00 |
By first-order margin the hero wins and the bundle is last. By 12-month contribution the bundle wins at A$75.00 and the starter kit earns 2.5 times the candle. The bundle makes five times less on the sale and 1.4 times more over the year. Cut it to protect margin and you switch off your best acquisition.
Two products of yours. Which one wins the year?
Enter each product's first-order contribution, its repeat orders in 12 months and the contribution per repeat order, and it shows the 12-month contribution per customer, the lifetime multiple, and whether that flips your unit-margin ranking.
Ranked by unit margin, Product A looks like the winner. Ranked by the 12-month contribution of the customers it brings in, Product B is worth 2.5x more. That is the flip a best-sellers report can never show you.
A two-product sketch, assuming steady repeat behaviour. Blufire runs this across your whole catalogue, on real orders, reconciled to your ledger to the dollar. Nothing you type here leaves your browser.
Repeat rate by entry product, in contribution margin.
Section S4, Customer Value, ranks what actually drives repeat purchase. The entry-category repeat scorecard and the first-order value to repeat curve show which first purchases create repeat customers and which create one-and-done buyers, and the ranked repeat drivers make the why explicit.
The Entry Product x Channel matrix then shows where those first orders come from, set to new customers only and read in credit-weighted CM1, so you know which products belong at the front door of which channel.
- Entry-category repeat scorecardWhich first-purchase categories create repeat customers and which create one-and-done buyers.
- First-order value to repeat curveWhether bigger first baskets actually produce more repeat customers, or fewer.
- Ranked repeat driversWhat separates the customers who come back from the ones who do not, in order of weight.
- Entry Product x Channel matrixWhich channel acquires customers on which products, in true CM1 after COGS.
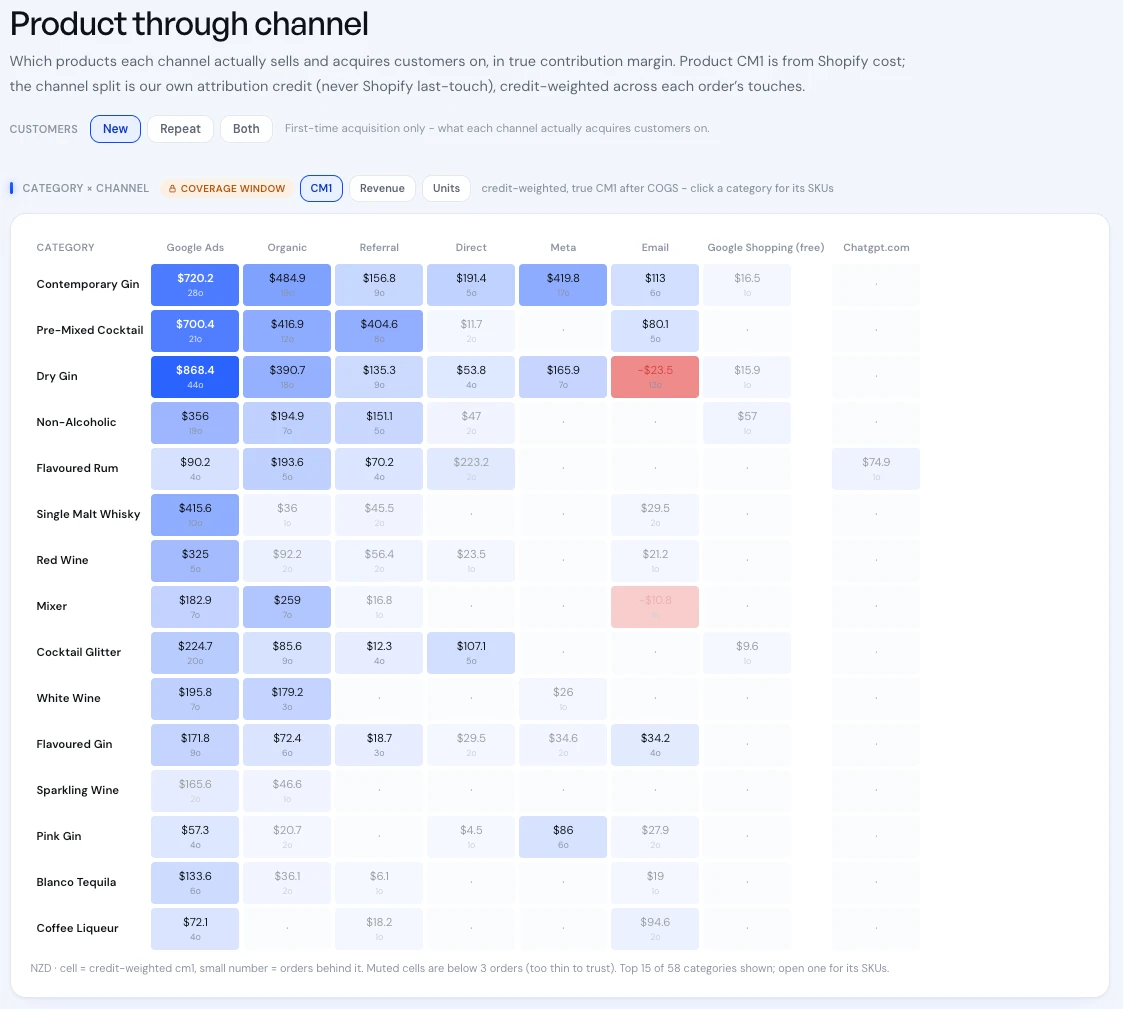
Real product screen, shown on sample data.
The team behind the numbers.
 A$5k to A$170ka month in eight months, with the finish carrying 85% of revenue de-riskedRead the case study →
“Quick to take action, and bring a lot of experience… a partner who can strategically execute and adapt to fast-paced industries.”














The decision you walk away with.
Best-sellers are ranked by revenue and unit margin.
Entry products are ranked by the 12-month margin of the customers they bring in.
The thin-margin starter item is first on the cut list.
It is protected, because the scorecard shows it creates your repeat buyers.
Ad spend follows the product with the biggest first order.
Each channel leads with the entry product that repeats best through it, read in channel CM1.
Repeat purchase rate is one store-wide number.
It is split by first product, first-order value and channel, so you can act on it.
Checking it in Shopify, and where that stops.
- List your front doors.Shopify's first-time versus returning customer reports show what first-time buyers actually purchase.
- Follow each group forward.Segment customers by first product and watch them in cohort analysis. Did they reorder, and did they move into your core range?
- Weight it by margin.With cost per item filled in, multiply repeat orders by contribution. The margin LTV calculator does the lifetime version, and LTV on margin explains the method.
- Then tie it to acquisition.Knowing the winner is half the job. Finding more customers like them is where the entry product earns its place in the brief.