Problems we solve / The customers / About to stop buying
Problem 06 of 16 · The customersWhich customers are about to stop buying, and what are they worth if we save them?
Your email platform can already predict who is likely to lapse. What it cannot tell you is how much margin walks out the door with each of them. So the win-back budget chases the customers who are easiest to predict, not the ones worth saving.
Good churn prediction answers two questions: who is drifting, and what they are still worth in contribution margin if you keep them. Blufire's 7-State Lifecycle Board shows who is sliding toward churn this period, and BTYD-predicted CLV prices each one, so the win-back goes to the margin at stake rather than the top of a risk score.
5.0 on Google · 100+ businesses · $153M revenue influenced
Same churn risk, opposite worth.
Two customers, both scored 84% likely to churn. Gross margin is after COGS, shipping and fees. Returns cost the margin on every order sent back.
Ranked by churn risk it is a tie. Ranked by margin at stake, one customer is worth A$435.51 a year and the other costs you A$39.60.
Scale it up. A flow that wins back 90 customers a month, chosen by risk, saves a mix whose average 12-month margin might be A$40: A$3,600 recovered. The same 90 saves chosen by margin at stake, averaging A$135, recover A$12,150. Same flow, same effort, 3.4 times the contribution.
Same win-back effort. Which ranking recovers more?
Enter how many customers your win-back flow reconverts a month and the average 12-month margin of a save under each ranking, and it shows the margin recovered chasing churn risk against chasing the margin at stake.
Same win-back effort. Ranking your at-risk list by margin instead of churn risk recovers A$8,550 more a month , about 3.4x the return. You stop spending offers on customers you are better off losing.
A simple sketch. Blufire scores every customer's drift nightly and ranks the at-risk list by the margin at stake, straight to Klaviyo. Nothing you type here leaves your browser.
A churn score is a probability, not a P&L.
Klaviyo's predictive analytics give you a churn risk and an expected next order date for each profile. Useful, but built from order value and timing, not from what each order cost you, so the list ranks customers by how likely they are to lapse and by how much they are predicted to spend.
Those are different lists from the one you need. A high-risk customer who only ever bought on discount and returned half of it is not worth a win-back offer: saving them means paying them to keep losing you money. A quietly lapsing full-price regular is worth chasing hard. The risk score cannot tell them apart, because it has never seen your contribution margin.
Timing makes it worse. A fixed "90 days since last order" flow treats a monthly buyer and a twice-yearly buyer the same, so the monthly buyer has been gone two cycles before the offer lands.
Who is drifting, and what they are still worth.
Section S4, Customer Value, puts every customer in one of seven states: New, Champions, Loyal, Potential, At risk, Hibernating and Lost. Each state shows its customer count, the CM1 it holds, days since last order and a 12-week trend, and any state clicks through to its customers.
State-to-State Migration reads who slid between states over the window, with the net CM1 that moved, and flags the biggest leak as a list you can open. Survival curves and BTYD-predicted CLV then price what each drifting customer is still likely to be worth, so the win-back is sized in dollars, not sentiment.
- 7-State Lifecycle BoardEvery customer in a lifecycle state, with the CM1 held in each and the at-risk pool to win back before it hibernates.
- State-to-State MigrationWho moved between states this period, the CM1 that moved with them, and the single biggest leak.
- Survival curvesHow the chance of another order falls as time since the last one grows, so drift is caught early.
- BTYD-predicted CLVWhat each at-risk customer is likely to be worth if they stay, in margin, to rank the win-back list.
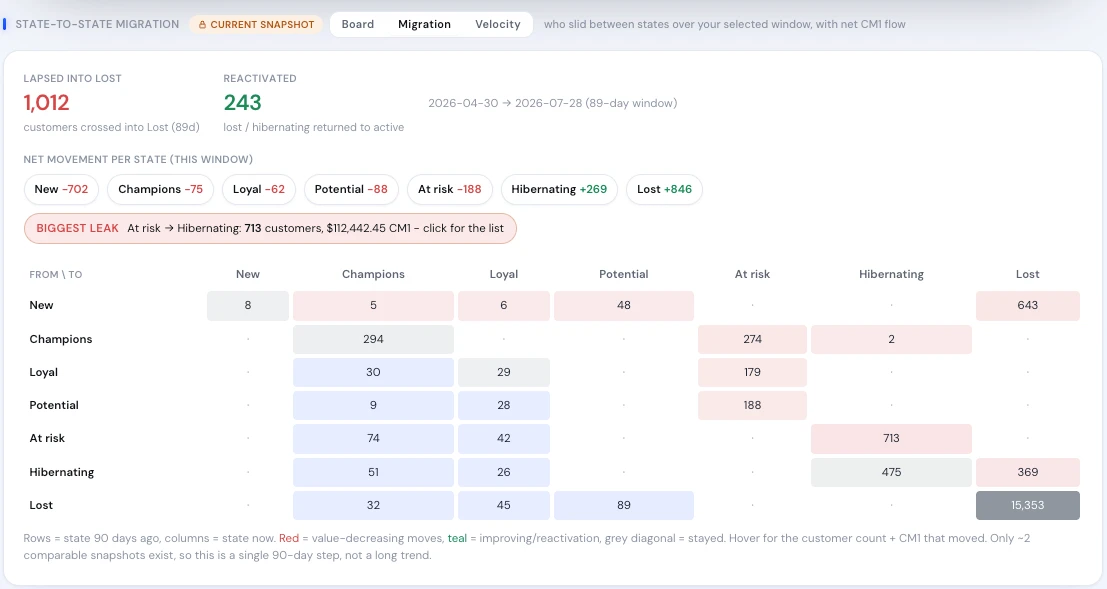
Real product screen, shown on sample data.
The team behind the numbers.
“…no request was too hard for them. Always clear communication and amazing results with the delivered product. Highly recommend Blufire.”















Where churn prediction usually goes wrong.
- Ranking the list by risk alone.Risk says who is leaving. Margin says whether it matters. Multiply the two, or the budget goes to the easiest predictions.
- Using revenue as the value score.Predicted spend ignores discounts, returns and product mix. Price the save on margin LTV, the method set out in LTV on margin.
- Offering the same discount to everyone.A code to a full-price regular gives away margin you would have kept. Match the offer to what the customer is worth, and to how dependent they are on discounts.
- Never measuring the lift.Some win-backs would have returned on their own. Hold a slice of the list back as a holdout to see what the flow actually caused.
The decision you walk away with.
The win-back list is sorted by churn risk or predicted spend.
The at-risk list is sorted by the margin at stake.
Discount-only buyers get the richest win-back offer.
Customers with negative contribution are let go quietly, and the offer budget moves up the list.
One fixed timer fires for every customer.
Migration shows who slid from Champions or Loyal into At risk this period, before they hibernate.
Win-back success is measured in reactivated customers.
It is measured in the CM1 those customers carry, and the audience goes to Klaviyo through the Activation Bridge.