Same shape, three different numerators and denominators.
Every CAC is spend divided by customers. What changes is which spend and which customers.
| Term | What it means |
|---|---|
| Blended CAC | Total sales and marketing spend ÷ all new customers, from every channel, paid or not. Answers: how efficient is the whole engine? See blended CAC. |
| Paid (new-customer) CAC | Paid media spend ÷ new customers acquired through paid. Answers: is paid acquisition sustainable, and how do we compare with peers? See new-customer CAC. |
| Marginal CAC | Δ spend ÷ Δ new customers between two spend levels. Answers: should the next dollar go in? See marginal CAC. |
The first two divide a total by a total and give an average. The third divides a change by a change and gives a slope. On a paid channel that is saturating, the slope sits above the average, because the auction reaches your cheapest, most likely buyers first and each extra dollar reaches a colder audience.
Three honest CACs from the same spend.
A store spends A$120,000 on sales and marketing: A$90,000 of paid media and A$30,000 of agency, content and tools. It wins 1,500 new customers, 900 of them through paid. Last month, paid spend was A$75,000 and paid won 790.
All three are correct. The board hears A$80 and assumes the next customer costs A$80. The last A$15,000 actually bought customers at about A$136 each (A$136.36 unrounded). Whether that was worth it depends on what those customers return in margin, not on the A$80.
A$82 on average, A$263 at the margin.
The demonstrative channel published on The Math and in the three CACs: five A$50,000 spend tranches, each buying customers at a higher cost than the last. Customer counts are derived from the published tranche costs and rounded.
Same account, same month. Report the A$82 and scale on it, and you walk straight into the A$263 customers. If a new customer's first-order margin is well under A$263, the fifth tranche is losing money while the average still looks fine.
Pick the question, then the number.
| Decision | Use | Why not the others |
|---|---|---|
| Is the whole go-to-market efficient? | Blended CAC | Paid CAC ignores the organic and referral customers your total spend also pays for. |
| How do we compare with other brands? | Paid CAC | Published benchmarks are mostly built on paid-acquired customers; blended flatters a brand with strong organic. |
| Should we add budget to this channel? | Marginal CAC | Both averages lag the rising cost of the next customer. |
| How long is cash tied up per customer? | Paid or marginal CAC, over monthly margin | CAC alone says nothing about time. Use CAC payback. |
Where customer acquisition cost goes wrong.
- Quoting CAC without saying which.The same brand can honestly report numbers several times apart. Label every CAC with its definition.
- Scaling on the average.Average CAC drifts up gently while marginal CAC climbs fast. Compute the slope before every budget change.
- Counting customers from platform conversions.Platforms over-claim, so the customer count in the denominator is inflated. See platform over-claiming.
- Judging CAC without margin.A CAC is only good or bad against what the customer returns. Hold it against margin LTV and payback.
All three CACs, per channel and cohort, in margin.
Section S2, Unit Economics, tracks new-customer CAC and CM-payback per acquisition cohort, and Marginal CAC & Saturation shows where the next dollar of spend on each channel stops paying. The Payback Waterfall turns that into months to breakeven, cohort by cohort.
At the top of the product, the executive Portfolio Headline carries blended MER and CM payback, the time for CM1 to recover acquisition cost, next to revenue and contribution margin.
- Cohort economicsNew-customer CAC and CM-payback per acquisition cohort, in margin rather than revenue.
- Marginal CAC & SaturationWhere each channel's next dollar stops buying customers profitably.
- Payback WaterfallMonths to breakeven, cohort by cohort.
- Portfolio HeadlineBlended MER and CM payback beside net revenue and CM1.
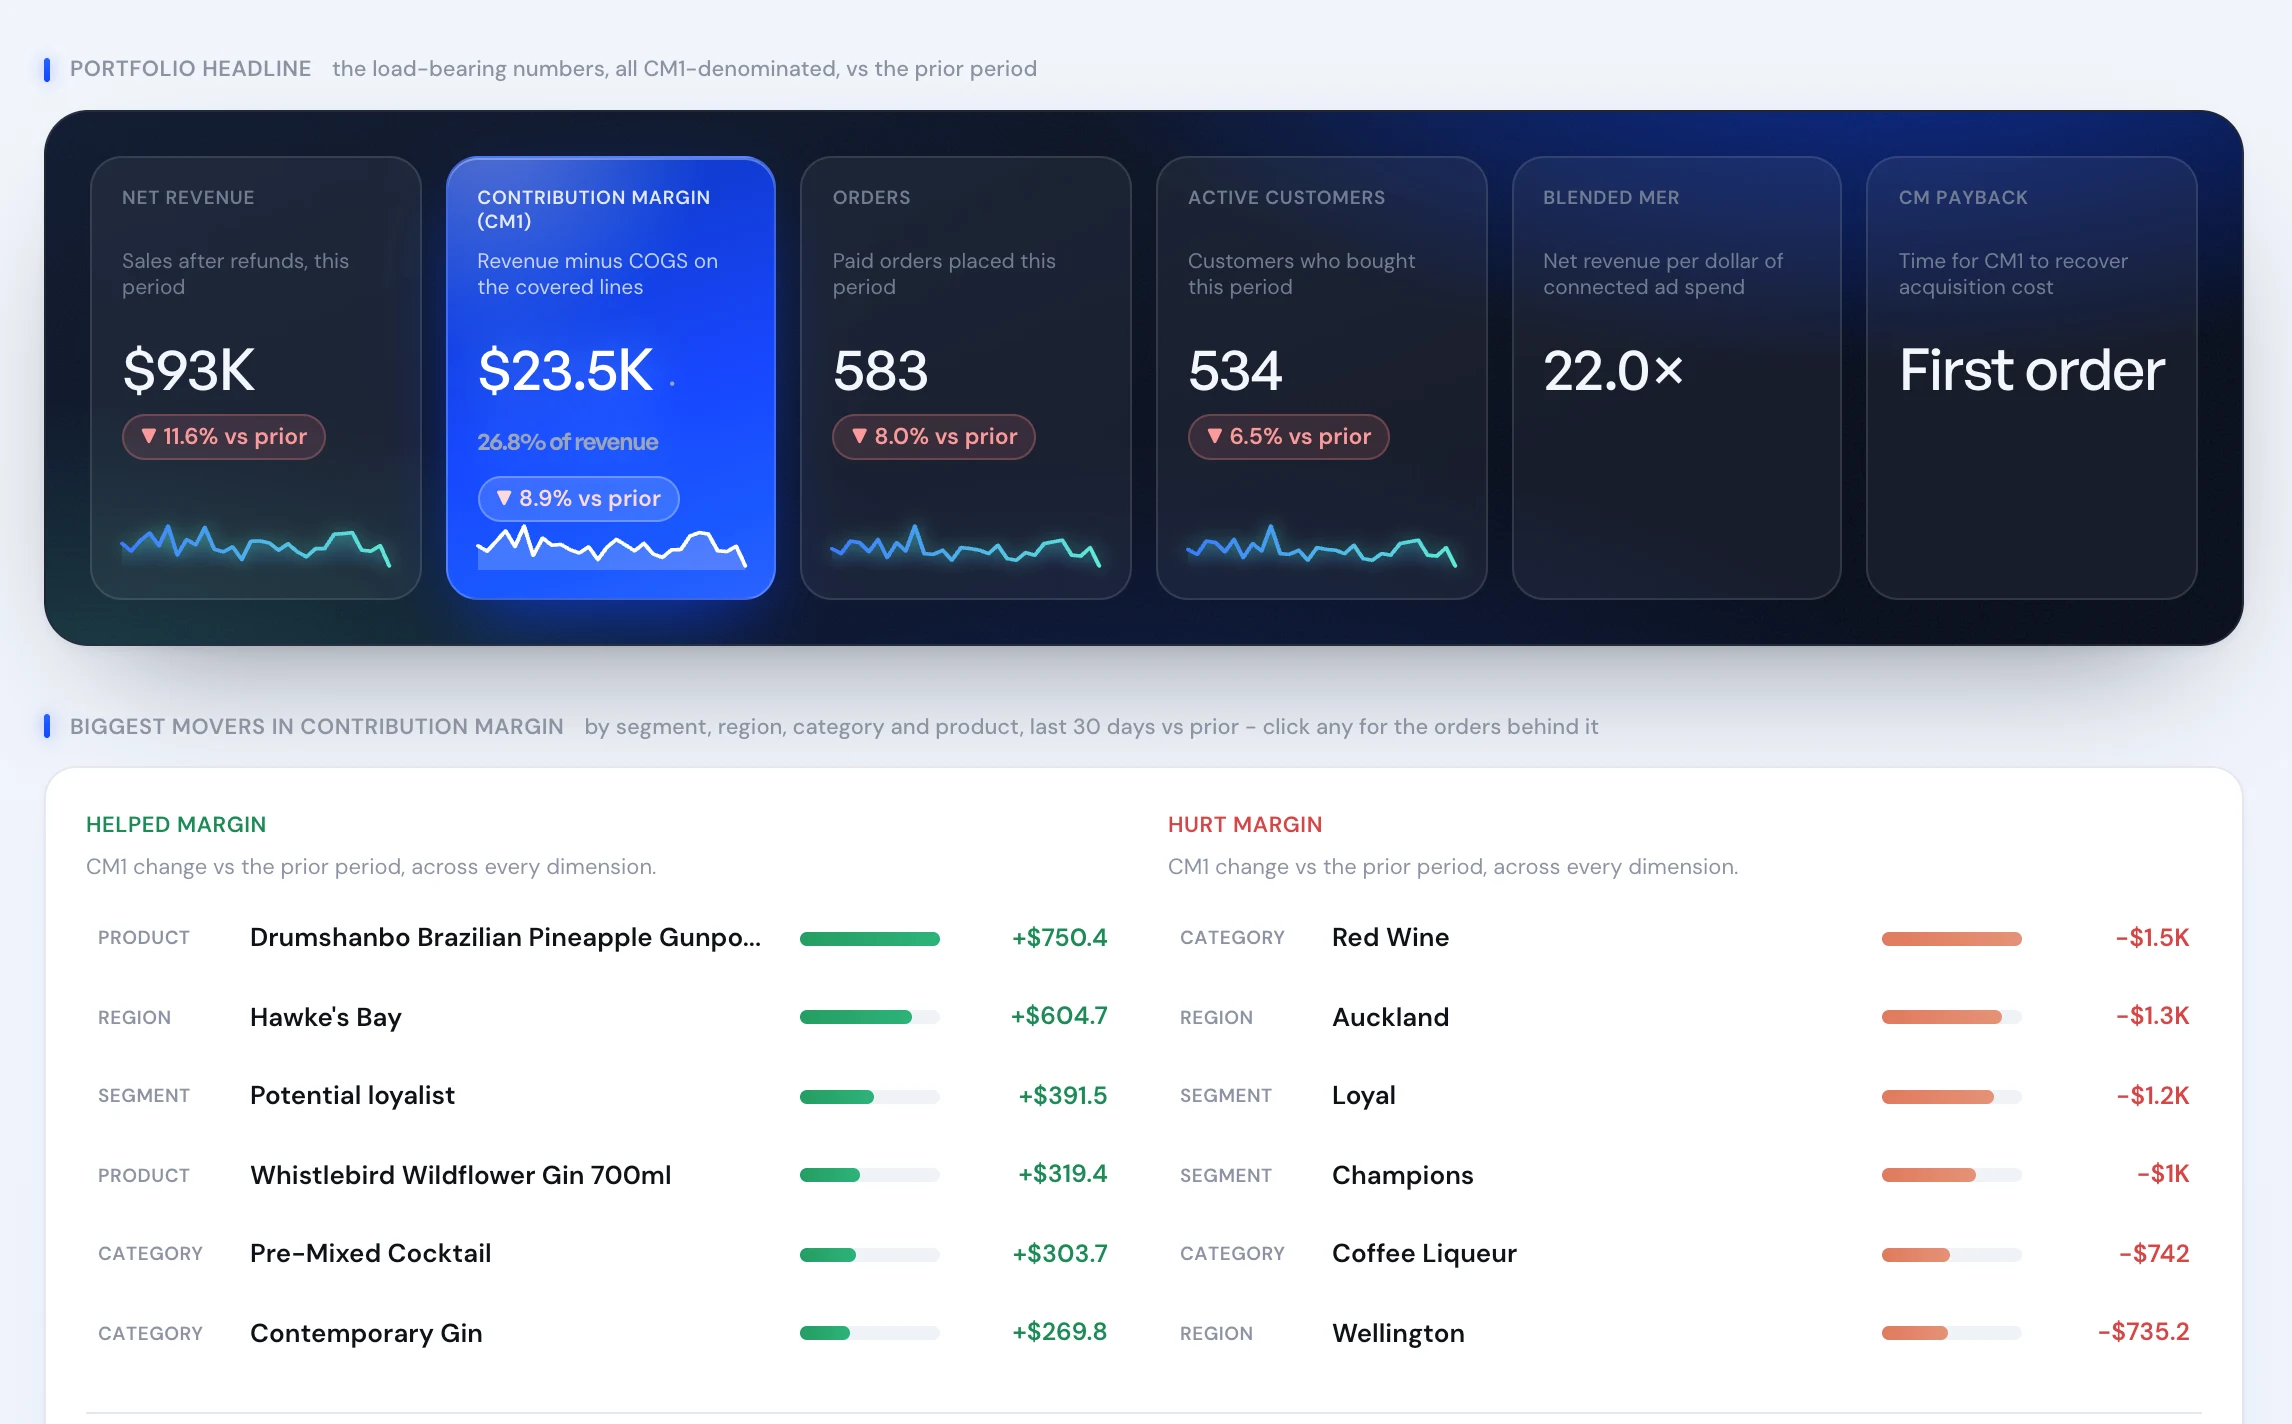
Real product screen, shown on sample data.
“Quick to take action, and bring a lot of experience… a partner who can strategically execute and adapt to fast-paced industries.”
 89 enquiriesat A$89 each in three months, scored and fed straight to dealersRead the case study →
5.0 on Google · 100+ businesses · $153M revenue influenced