Elasticity, measured the midpoint way.
The simple version divides each change by its starting value. That gives a different answer for a rise than for the same fall back, which is why economists use the midpoint (arc) method for any real before and after.
| Term | What it means |
|---|---|
| Q₁, Q₂ | Units sold per period before and after the price change, with traffic, promos and season held as steady as you can. |
| P₁, P₂ | The real selling price before and after, net of any standing discount. |
| E | Normally negative: price up, units down. Beyond −1 is elastic (volume reacts more than price); between 0 and −1 is inelastic. The price elasticity entry covers the definition. |
Elasticity is a volume number. It says nothing about money until you put the margin per unit next to it, which is the part most pricing analysis skips.
A$45 to A$50, and the method changes the answer.
A store's best-selling candle sells 2,400 units a month at A$45. The price goes to A$50 and, a comparable month later, units settle at 2,160.
The simple method calls the rise inelastic and the reverse cut elastic, from the same two data points. The midpoint method gives −1.00 both ways: volume moved exactly in proportion to price. On revenue that reads as nothing happened: A$108,000 before (2,400 × A$45) and A$108,000 after (2,160 × A$50).
Revenue flat, CM1 up 8%.
Same candle. Landed COGS is A$20 a unit and does not change with the price.
Revenue moved 0%. CM1 moved +8.0%, on 240 fewer orders to pick, pack and ship, so deeper margin rungs improve further. The rise pays until volume falls to 2,000 units a month, where CM1 is back at A$60,000 (2,000 × A$30).
What A$45 to A$50 does at different elasticities.
| Units after | Midpoint elasticity | Revenue | CM1 | CM1 vs A$60,000 today |
|---|---|---|---|---|
| 2,300 | −0.40 | A$115,000 | A$69,000 | +A$9,000 |
| 2,160 | −1.00 | A$108,000 | A$64,800 | +A$4,800 |
| 2,000 | −1.73 | A$100,000 | A$60,000 | A$0 (break-even) |
| 1,850 | −2.46 | A$92,500 | A$55,500 | −A$4,500 |
Demonstrative numbers. At −1.73 revenue has fallen A$8,000 and margin has not moved. The break-even elasticity is set by your margin, which is why the same elasticity can justify a rise in one store and not another.
Elasticity on your own data, priced in margin before you move.
Section S12, Financial Models, runs price elasticity on your own order history, showing its inputs, its formula and the records behind the answer, so the number can be checked rather than taken on trust.
Section S11, Planning & Forecasting, takes it from there. The what-if lab stress-tests a COGS, AOV or discount move before you make it, the forecast fans project revenue, CM1, demand and cash, and Plan-vs-Actual tracks what the change really did with a CM1 variance waterfall.
- Price elasticity modelElasticity estimated on your own data, with inputs, formula and records exposed.
- What-if labA COGS, AOV or discount change stress-tested before you commit.
- Forecast fansRevenue, CM1, demand and cash projected ahead with a range, not a single line.
- Plan-vs-ActualA CM1 variance waterfall showing what the change actually did.
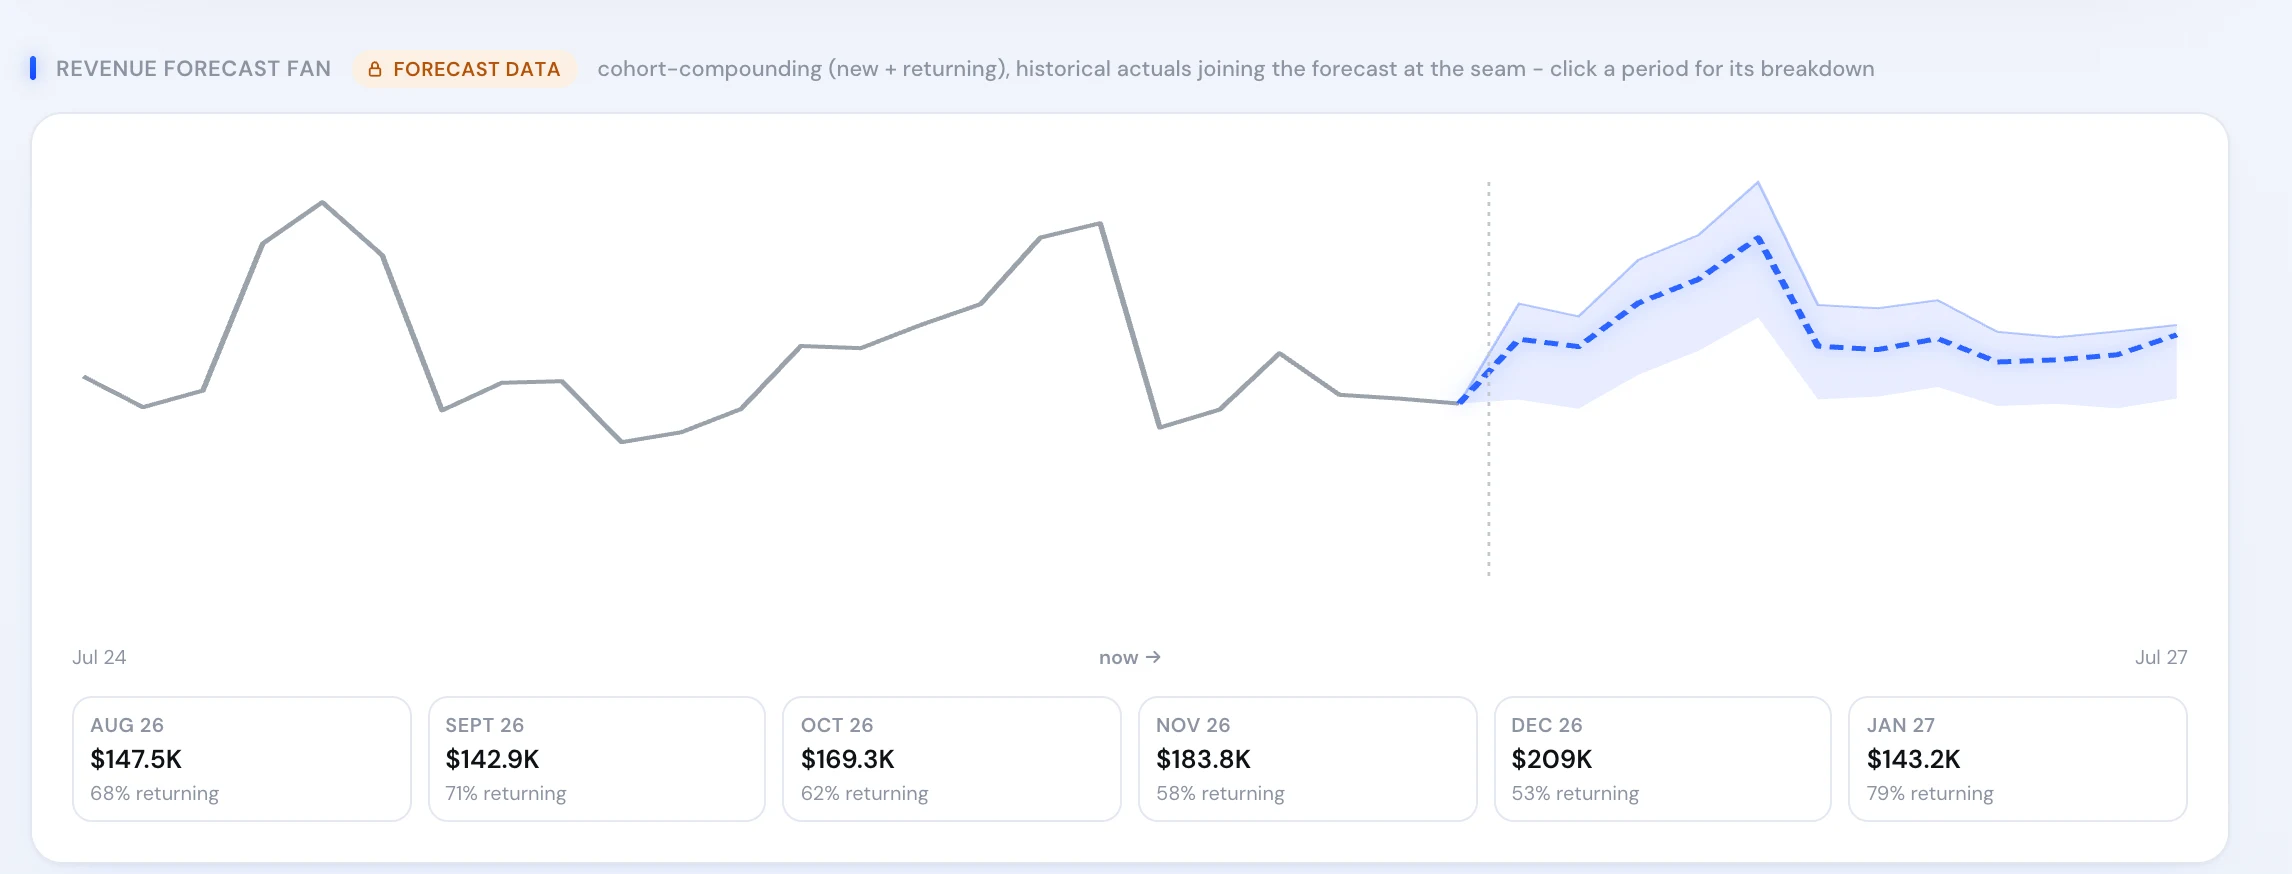
Real product screen, shown on sample data.
Where price elasticity analysis goes wrong.
- Using the simple percentage method.It gives a different elasticity for a rise and the same fall back. Use the midpoint for any real before and after.
- Stopping at revenue.Flat revenue hid a +A$4,800 month above. Judge every price move on contribution margin.
- Reading a promo as elasticity.A sale badge measures discount psychology, not a quiet base-price change. Score promos with discount impact instead.
- Forgetting the rest of the plan.A price change moves units, which moves stock and cash. Feed it into demand forecasting and scenario analysis before you commit.
“…no request was too hard for them. Always clear communication and amazing results with the delivered product. Highly recommend Blufire.”
 A$0 to A$1Min under 12 months, in one of retail's most price-brutal categoriesRead the case study →
5.0 on Google · 100+ businesses · $153M revenue influenced