What's Inside / The money / S2 Unit Economics
Unit economics, down to the product, channel and cohort
Blended margin hides everything interesting. One product carries the range, one channel loses money on every first order, one cohort never comes back. Section S2, Unit Economics, pivots profit by any dimension you sell across, so you can see where margin is made and where it leaks.
Unit Economics is one pivotable Profitability Cube of contribution margin by product, channel or cohort, with a CM1 waterfall showing what each cost line took. A Ranked Leak Queue orders every leak by dollars recoverable, and cohort economics shows how long each acquisition cohort takes to pay back.
5.0 on Google · 100+ businesses · $153M revenue influenced
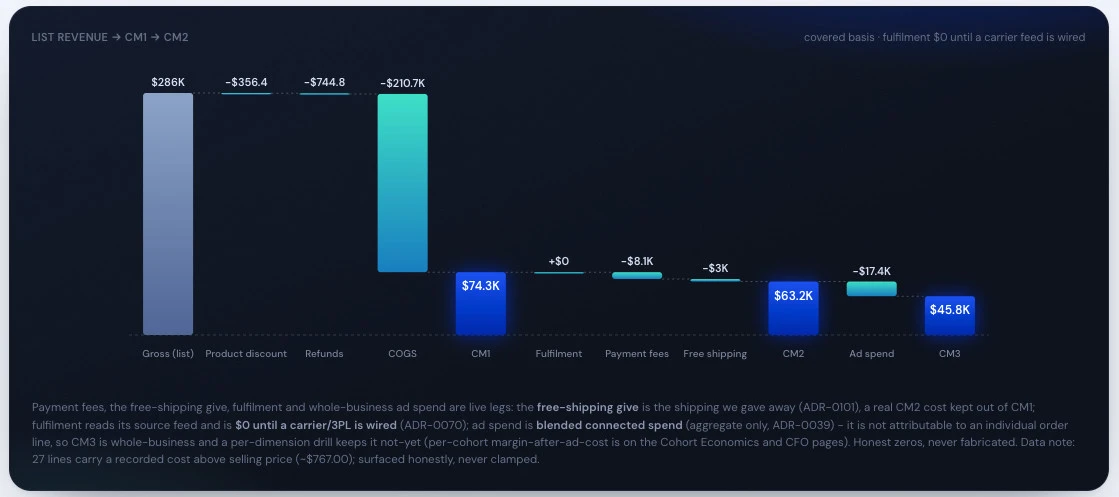
Real product screen, shown on sample data.
From list price to CM3, one cost line at a time.
The CM waterfall starts at gross list revenue and takes each cost off in order: product discount, refunds and landed COGS to reach CM1, then fulfilment, payment fees and the free-shipping give to reach CM2, then ad spend to reach CM3. Where a cost feed is not connected yet, the line reads zero and says so, rather than inventing a number.
The same maths sits under the Profitability Cube, so any cell of the pivot (one SKU, one channel, one cohort) can be traced through the same waterfall and bridge.
“…getting those visitors to convert into customers. They are hard workers… I highly recommend Brendan and the team.”
 A$5k to A$170ka month in eight months, with the finish carrying 85% of revenue de-riskedRead the case study →










One order, from list price to what is left.
A first order at A$120 list price, bought with a 10% code, from a customer who cost A$70 to acquire (their new-customer CAC).
Revenue says A$108 came in. The waterfall says A$40 was left after the order was delivered, and the customer is still A$30 short of paying back what they cost. At A$40 of CM2 per order, they need a second order before acquisition is recovered.
That is why payback is read per cohort. If this cohort's repeat rate is low, the channel that acquired it is losing money on every customer, however good its ROAS looks. Model your own version with the CM payback calculator, or read the maths behind the three layers on CM1, CM2 and CM3.
From one blended margin to a margin for everything.
Gross margin is known for the store as a whole, and nobody trusts it per product.
CM1, CM2 and CM3 for any product, channel or cohort, from one cube.
Leaks are found by accident, usually after a bad month.
A Ranked Leak Queue sorted by recoverable dollars, and a tracker that checks the fix held.
Payback is quoted in revenue, so every channel looks like it pays.
NCAC and CM payback per acquisition cohort, read in margin.
Missing cost data is guessed or left out silently.
A cost line with no feed reads zero and says why.
Where is margin made, and how long does a customer take to pay back?
Unit economics is the profit and loss of one unit: an order, a customer or a SKU. The trouble is that most stores only see the average unit. The average hides a hero product subsidising three that lose money after refunds, or a channel whose first orders never cover what they cost to win.
S2 answers two questions. The first is where exactly margin is made, and where it is leaking: the cube and the waterfall find it, and the Ranked Leak Queue puts the biggest recoverable dollars at the top. The second is how long a new customer takes to pay back what they cost to acquire: cohort economics tracks it in margin, not revenue, because revenue payback flatters every channel.
The same cube, pivoted four ways.
The founder pivots by product to see which lines actually carry the business, and works the Ranked Leak Queue from the top, because it is sorted by the money on the table.
The CFO reads the waterfall and bridge. When margin moves between periods, the bridge says which cost line moved it, and the Recovery Tracker shows whether last quarter's fixes held.
The CMO pivots by channel and cohort. Payback Waterfall shows the months to breakeven for each acquisition cohort, and Marginal CAC & Saturation shows where the next dollar of spend stops paying, which is the question before any budget increase.
Ops reads the product view for the leaks that are really costs: a SKU whose landed COGS rose, or one whose refunds wipe out its margin.