ROAS, and the two lines that make it useful.
| Term | What it means |
|---|---|
| Attributed revenue | The revenue the platform or attribution model credits to the campaign. It is a claim, not a receipt. |
| Ad spend | Media cost for the same campaign over the same period. |
| CM2 % | Contribution margin before marketing: revenue less landed COGS, fulfilment, shipping and payment fees, as a share of revenue. Worked in full on CM1, CM2 and CM3. |
| POAS | Margin earned per ad dollar. The POAS glossary entry defines it; break-even is always 1.0. |
Use CM2, not gross margin and not CM3. Gross margin still contains fulfilment and fees, so it makes the floor look easier to clear. CM3 has already taken the ad spend off, so using it counts marketing twice. The ROAS and break-even ROAS glossary entries cover the definitions.
A 4.0x campaign, converted to margin.
One campaign, one month, selling discount-heavy product with a 30% CM2.
A 4.0x reads as a strong campaign. On a 30% margin it clears its 3.33x floor by a thin A$2,000, if the platform's revenue figure is right. The same 4.0x on a 62% CM2 would leave A$14,800 (A$24,800 − A$10,000). Revenue ROAS cannot tell those campaigns apart; POAS can, instantly.
The same campaign, after the over-claim.
Platforms count revenue they touched, not revenue they caused. Meta over-reports roughly 26% above third-party analytics on average (Measured, 2024, as cited on The Math). Applying that average to example 1:
Two honest conversions turned a 4.0x winner into a campaign that loses money on every order. The 26% is an average across accounts, not your number: measure your own with a holdout or geo test, as covered on platform over-claiming. The gap can be far wider: The Math cites a documented Meta test that showed 2.1x true incremental return against 4.8x platform-reported.
ROAS, POAS and MER side by side.
Each ratio answers a different question. None of them fixes attribution on its own.
| Ratio | Formula | Break-even | Blind spot |
|---|---|---|---|
| ROAS | Attributed revenue ÷ ad spend | 1 ÷ CM2 % (3.33x at 30%) | Ignores margin; counts claimed revenue |
| POAS | CM2 on attributed orders ÷ ad spend | 1.0 | Still inherits the attribution error |
| MER | Total revenue ÷ total marketing spend | 1 ÷ CM2 %, store-wide | Cannot judge a single campaign |
Work out your own floor with the break-even ROAS calculator, or set an account-level target with the target MER calculator.
Where the ROAS formula gets misused.
- Judging ROAS without a floor.A 4.0x is a loss at a 20% CM2 and a comfortable win at 60%. Work out the floor first, then read the multiple. What is a good ROAS sets targets from it.
- Using one store-wide margin.Campaigns sell different products. A campaign pushing low-margin SKUs needs a higher floor than the store average suggests.
- Adding platform ROAS figures together.Attribution windows overlap, so one order can be claimed by several platforms. Platforms claim credit for up to 140% of actual revenue (per the sources cited on The Math).
- Counting existing customers as acquisition.Retargeting and branded search inflate ROAS with sales that may have happened anyway. Split new from returning before judging.
Creative and channels ranked on margin, not platform ROAS.
Section S10, Creative Analytics, ranks every creative attribute (hook, offer, CTA style, visual style, media type) by CM1-ROAS alongside spend, CTR, CPM and fatigue. The note under the ranking is explicit: the figures are never Shopify or platform-reported. An offer-led versus no-offer view compares the two sides directly.
At channel level, the Channel Read in S6 Marketing / Channels prices every source in CM1-MER, contribution margin over spend, so the account-level check runs on margin too.
- Creative LeaderboardRanks every asset by the CM1 it earns rather than the ROAS the platform reports.
- Winning AttributesShows what the earners have in common, so the next brief starts from evidence.
- Fatigue BoardCatches decay before it burns budget, with a Refresh Queue for what to replace next.
- Spend reconciliationReconciles platform spend against what the data honestly shows.
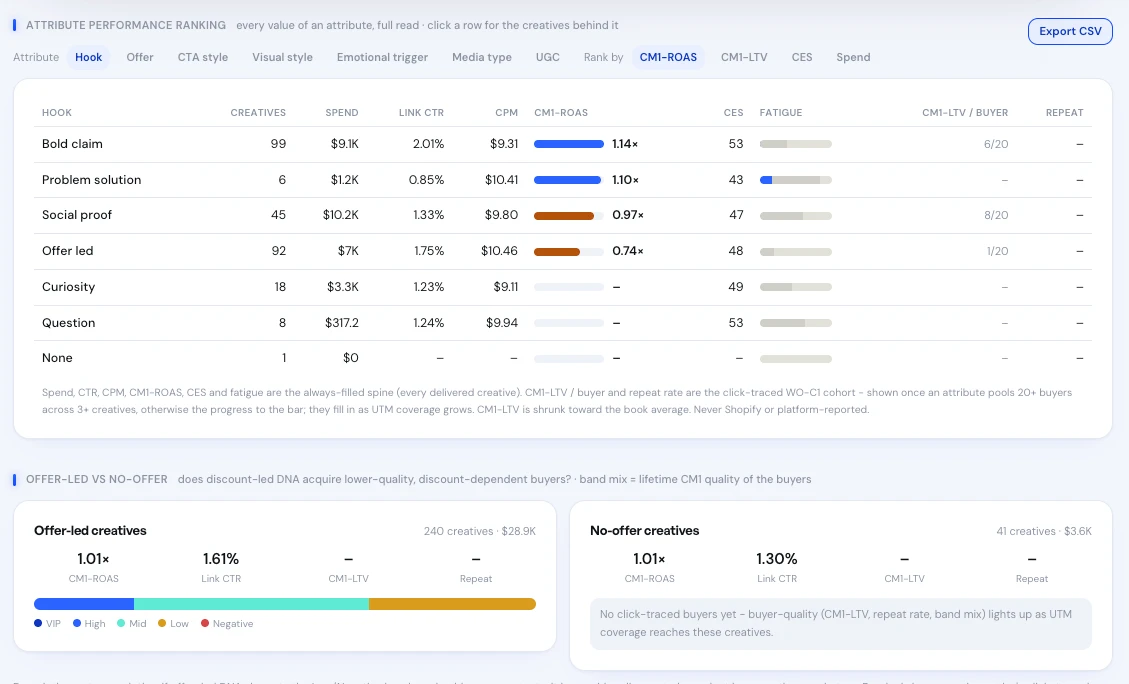
Real product screen, shown on sample data.
“…no request was too hard for them. Always clear communication and amazing results with the delivered product. Highly recommend Blufire.”
5.0 on Google · 100+ businesses · $153M revenue influenced