Problems we solve / The money / How long payback takes
Problem 04 of 16 · The moneyHow long does a new customer take to pay back what they cost to acquire?
Every new customer starts as a loss: you paid to acquire them before they paid you anything. The CAC payback period is how long that loss lasts. Measured on revenue it looks short and safe. Measured on the margin that actually comes back, it is usually several times longer, and that gap is money you are funding in the meantime.
Divide what the cohort cost to acquire by the contribution margin it returns, month by month, and count the months until the running total covers the cost. Blufire's Unit Economics section tracks new-customer CAC and CM-payback for every acquisition cohort, so you know the real payback window before you scale spend into it.
5.0 on Google · 100+ businesses · $153M revenue influenced
Revenue payback counts money you never keep.
The common shortcut compares new-customer CAC with the revenue a customer brings in. But most of that revenue goes straight back out: to the supplier, the courier, the payment processor. Only the contribution margin is available to repay the acquisition cost, so a revenue payback of one month can be a margin payback of nine.
The second trap is the average. One blended payback figure mixes cohorts acquired in a cheap month with cohorts acquired during a push, and channels that bring back repeat buyers with channels that bring one-and-done bargain hunters. The slow cohorts are the ones tying up cash, and the average hides them. That is why payback is read per cohort, not per business.
The third trap is scale. Average CAC describes the customers you already bought. The next customer, bought with the next tranche of spend, almost always costs more, because auctions reach the best prospects first. That is marginal CAC, and it is the figure that should set the payback you plan around (the three CACs are worked through on The Math).
One cohort, month by month.
400 new customers acquired in March at an NCAC of A$120: A$48,000 to recover. First orders average A$90 and the store's CM2 (after landed COGS, shipping, pick and pack and fees) is 45%. Worked example, demonstrative numbers.
| Month | Cohort revenue | CM2 this month | Cumulative CM2 | Left to recover |
|---|---|---|---|---|
| 0 (first orders) | A$36,000 | A$16,200 | A$16,200 | A$31,800 |
| 1 | A$12,000 | A$5,400 | A$21,600 | A$26,400 |
| 2 | A$10,800 | A$4,860 | A$26,460 | A$21,540 |
| 3 | A$9,600 | A$4,320 | A$30,780 | A$17,220 |
| 4 | A$8,400 | A$3,780 | A$34,560 | A$13,440 |
| 5 | A$7,800 | A$3,510 | A$38,070 | A$9,930 |
| 6 | A$7,200 | A$3,240 | A$41,310 | A$6,690 |
| 7 | A$6,600 | A$2,970 | A$44,280 | A$3,720 |
| 8 | A$6,000 | A$2,700 | A$46,980 | A$1,020 |
| 9 | A$5,400 | A$2,430 | A$49,410 | Paid back, +A$1,410 |
On revenue, this cohort "pays back" in month 1 (A$36,000 + A$12,000 = A$48,000). On gross margin at 58% it pays back in month 5. On CM2 it takes nine months, and for those nine months the business is carrying the gap. Check your own cohort in the CM payback calculator.
Same cohort, three different answers.
A marketer reading revenue would scale this channel hard. Someone reading CM2 knows each cohort locks up its acquisition cost for most of a year.
Payback also answers a question LTV:CAC cannot. The ratio says whether a customer is eventually worth more than they cost; it has no clock. As the glossary shows, two brands can both run 3:1 while one recoups in 4 months and the other in 30. Read the ratio on margin LTV, and always beside the payback window.
Payback per cohort, in margin, before you scale.
Section S2, Unit Economics, runs cohort economics: NCAC and CM-payback for every acquisition cohort, measured in contribution margin rather than revenue, because revenue payback flatters every channel. The Payback Waterfall shows the months to breakeven cohort by cohort, so a slow cohort stands out instead of disappearing into an average.
Marginal CAC & Saturation then shows where the next dollar of spend stops paying, which is the question behind every budget increase. The executive read carries the headline version too: CM payback, the time for CM1 to recover acquisition cost, sits in the Portfolio Headline beside contribution margin and blended MER.
- Cohort economicsNew-customer CAC and CM-payback tracked per acquisition cohort, in margin rather than revenue.
- Payback WaterfallThe months to breakeven, cohort by cohort, so the slow cohorts you are still funding are visible.
- Marginal CAC & SaturationWhere the next dollar of spend stops buying customers who pay back.
- CM payback in the headlineTime for CM1 to recover acquisition cost, read on the executive Portfolio Headline.
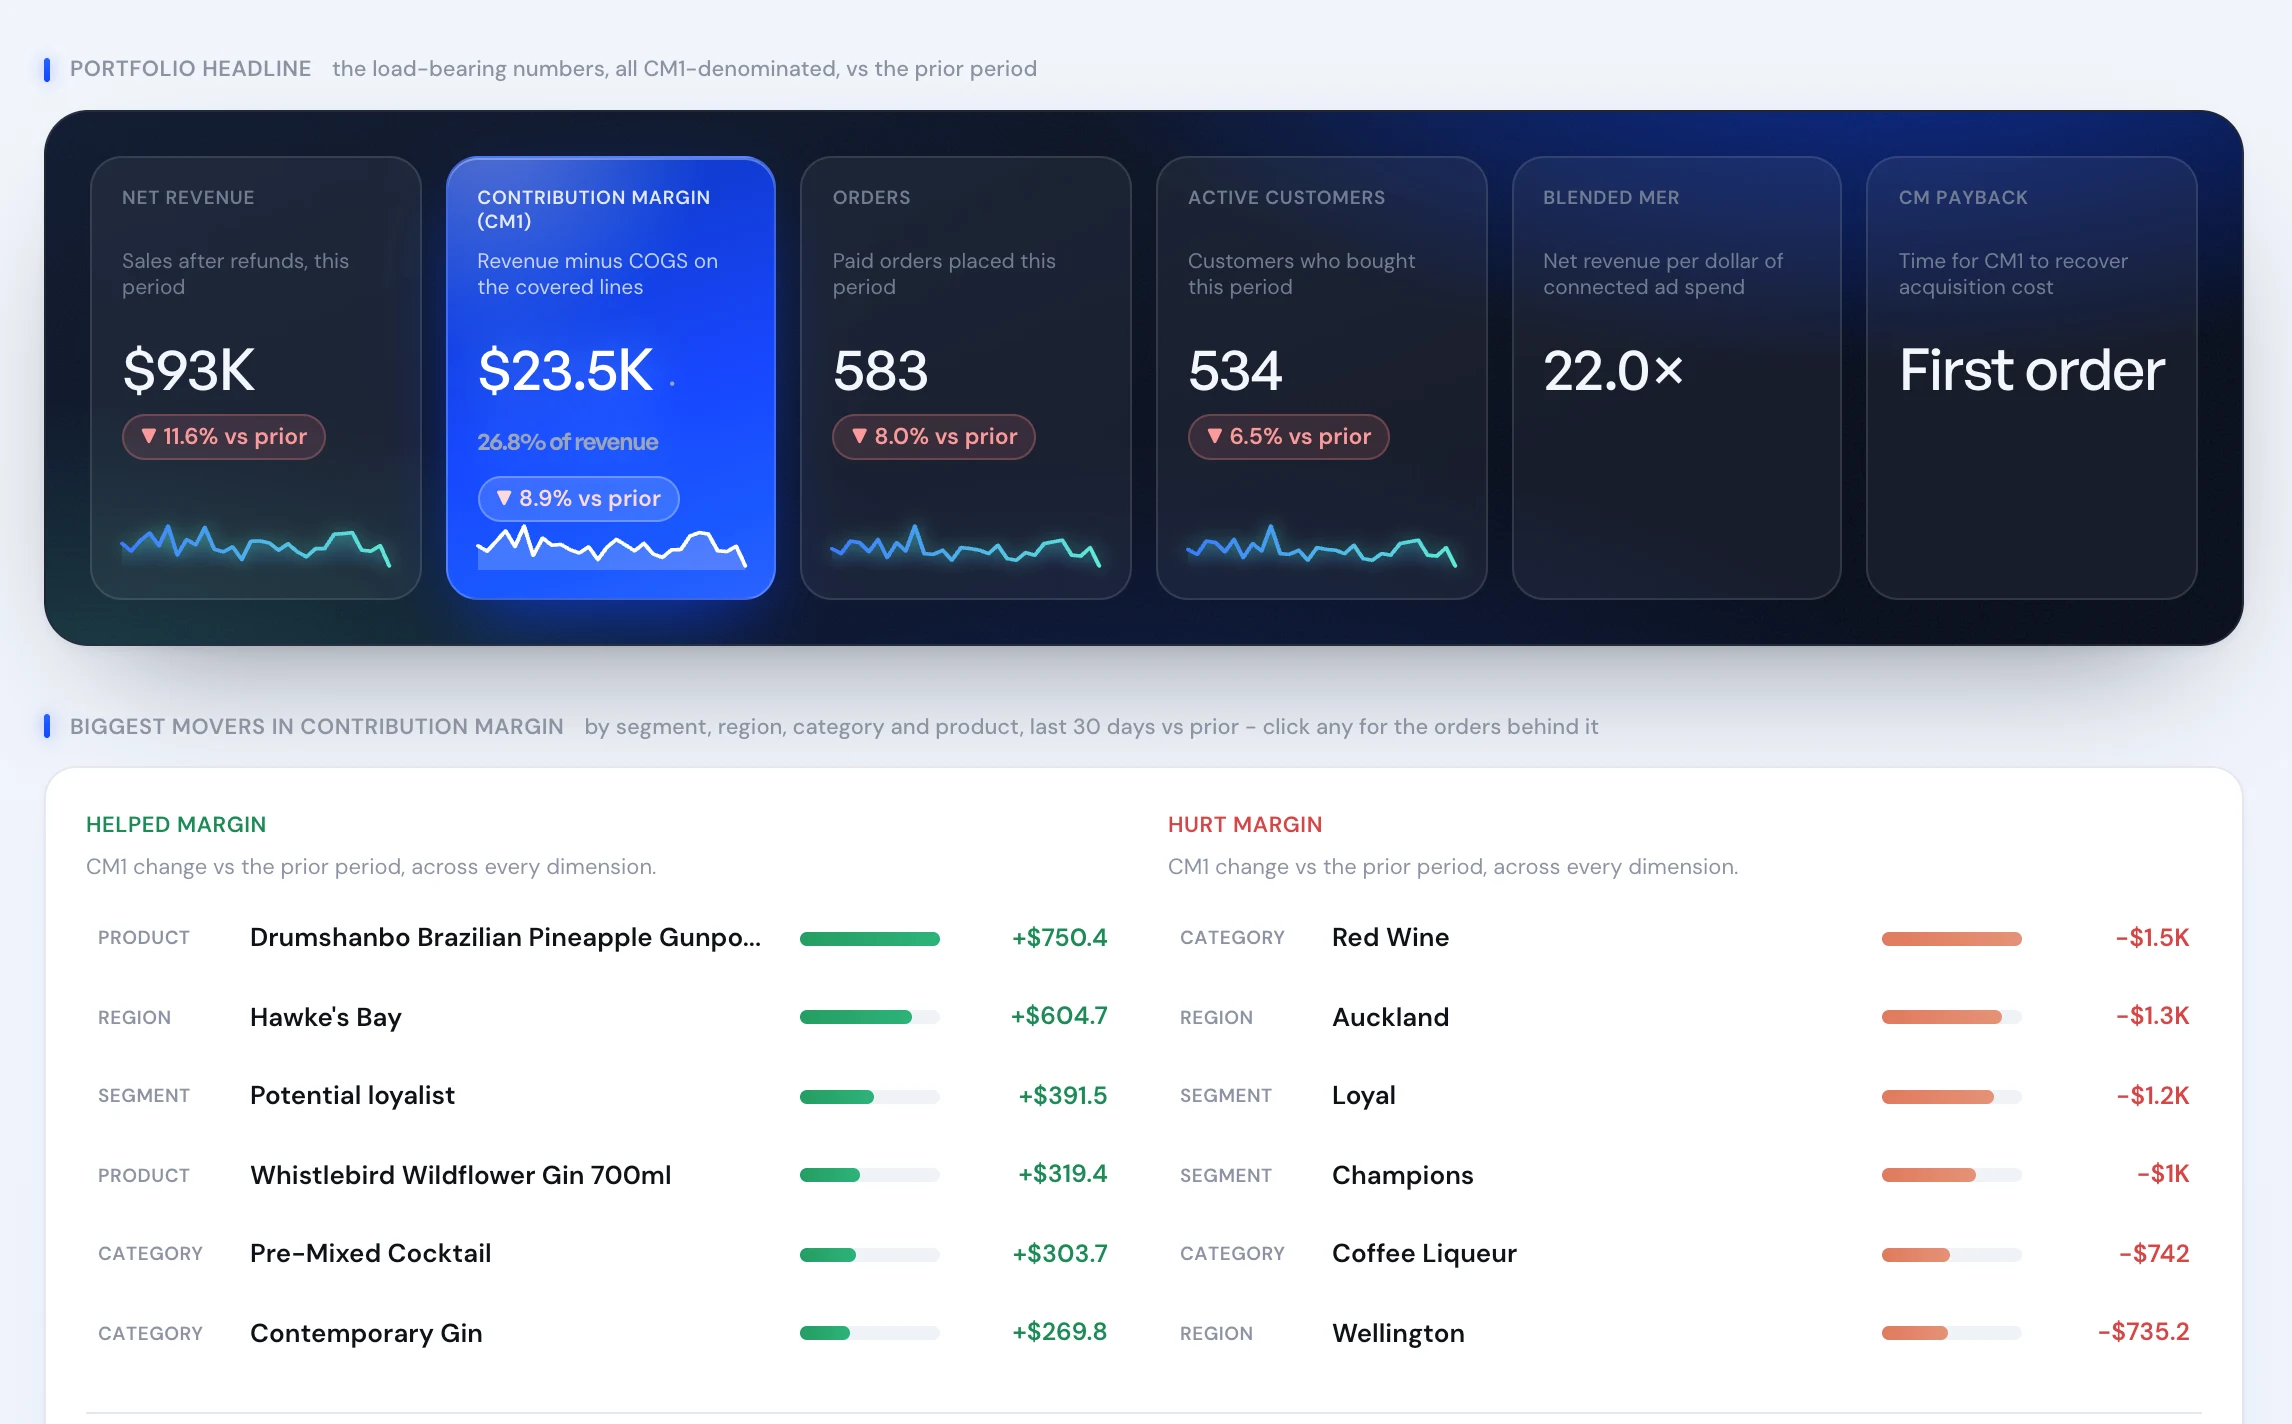
Real product screen, shown on sample data.
The team behind the numbers.
“Quick to take action, and bring a lot of experience… a partner who can strategically execute and adapt to fast-paced industries.”















The decision you walk away with.
Payback is judged on revenue, so every channel looks like it pays back fast.
Payback is read on contribution margin, the cash that actually comes back.
One blended payback figure for the whole business.
A payback curve for every acquisition cohort, slow ones flagged.
Budget goes up because the average CAC still looks fine.
Marginal CAC shows where the next dollar stops paying before it is spent.
LTV:CAC is quoted without a timeline.
The ratio sits beside the months it takes to arrive.
Where CAC payback calculations go wrong.
- Using revenue or gross margin as the repayment pool.Both overstate what comes back each month, so the payback period reads shorter than the cash reality.
- Using blended CAC for a paid channel.Organic customers in the denominator make paid acquisition look cheaper. Judge the paid engine on NCAC; work both out in the blended CAC calculator.
- Planning on average CAC.The next cohort costs more than the last. Plan the payback window on marginal CAC, and re-measure at each new spend level.
- Comparing channels on the first order only.Some channels bring buyers who repeat. Read each channel's cohorts to month 12 before calling it profitable or not.