Problems we solve / The money / Revenue up, no more money
Problem 01 of 16 · The moneyRevenue is up. Why is there no more money in the account?
The sales report and the bank balance are measuring different things. Revenue counts every dollar that moved through checkout; the account only receives what is left after product costs, shipping, fees, discounts, returns and ad spend. When those costs grow faster than sales, ecommerce profit margin shrinks while the top line celebrates.
Growth that doesn't reach the bank is almost always a margin problem hiding under a revenue win: deeper discounts, a cheaper product mix, more free shipping and rising acquisition cost each take a slice of every extra sale. Blufire's Executive section reads the business in CM1 terms and decomposes the period's move line by line, so you can see which slice grew.
5.0 on Google · 100+ businesses · $153M revenue influenced
Growth is usually bought, and the price comes out of margin.
Extra revenue usually arrives because something was pushed: a bigger promo, a lower free-shipping threshold, more ad spend into colder audiences. Each lever carries a cost that moves with the order. The revenue report records the lift, not the cost.
Four leaks do most of the damage. Mix shift: the products that grew fastest are often the cheaper, lower-margin ones, so landed COGS takes a bigger share of each dollar. Discounts: every code lowers revenue per order while the cost of the product stays put (see which codes give margin away). Shipping, fees and returns: free shipping and refunds scale with orders, not with margin (the cost of returns is its own problem). Rising CAC: the next customer costs more than the last, because the cheapest buyers were reached first.
Then there is timing. A growing store buys more stock before it sells it, so cash leaves the account weeks or months before the revenue comes back. Growth can be profitable on paper and still drain working capital. Check margin first: it is the one you can fix this month.
Revenue up 20%, contribution down 35%.
The same store, the same quarter, one year apart. Each line shows last year → this year, stepped down from revenue through CM1, CM2 and CM3.
Revenue grew A$80,000. CM1 grew too, by A$27,200, so a gross-margin report would say the quarter went well. But the extra orders cost more to ship, and the extra customers cost more to win. By CM3 the store contributed A$33,600 less than the year before, and rent, wages and software did not get any cheaper.
No single line is dramatic: four points on COGS, two on shipping, five on marketing. Small moves in the same direction took a third of the contribution. Put your own numbers through the Shopify P&L template.
One read of what you kept, and what changed it.
Section S1, Executive, opens on the Portfolio Headline: net revenue, contribution margin, orders and active customers, all read in CM1 terms against the prior period. When revenue is up and CM1 is flat, you see it on the first screen instead of at the accountant's quarterly meeting.
What Changed then decomposes the move. Every product, category, region and customer segment is ranked by how much CM1 it added or took away versus the prior period, split into what helped margin and what hurt it, and any line opens to the orders behind it. So "why is there no more money?" becomes a ranked list you can act on.
- Portfolio HeadlineThe business read in CM1 terms: what you actually kept after product costs, shipping, fees, discounts and ad spend.
- What ChangedThe period's move decomposed line by line, with the biggest margin movers ranked by segment, region, category and product.
- Role lensesA read for each seat, CEO, CFO, CMO, growth and ops, ranking the biggest problems for that role, down to a CFO scorecard over time.
- Data HealthConnector status and data health behind every number, so you know when a figure can be trusted.
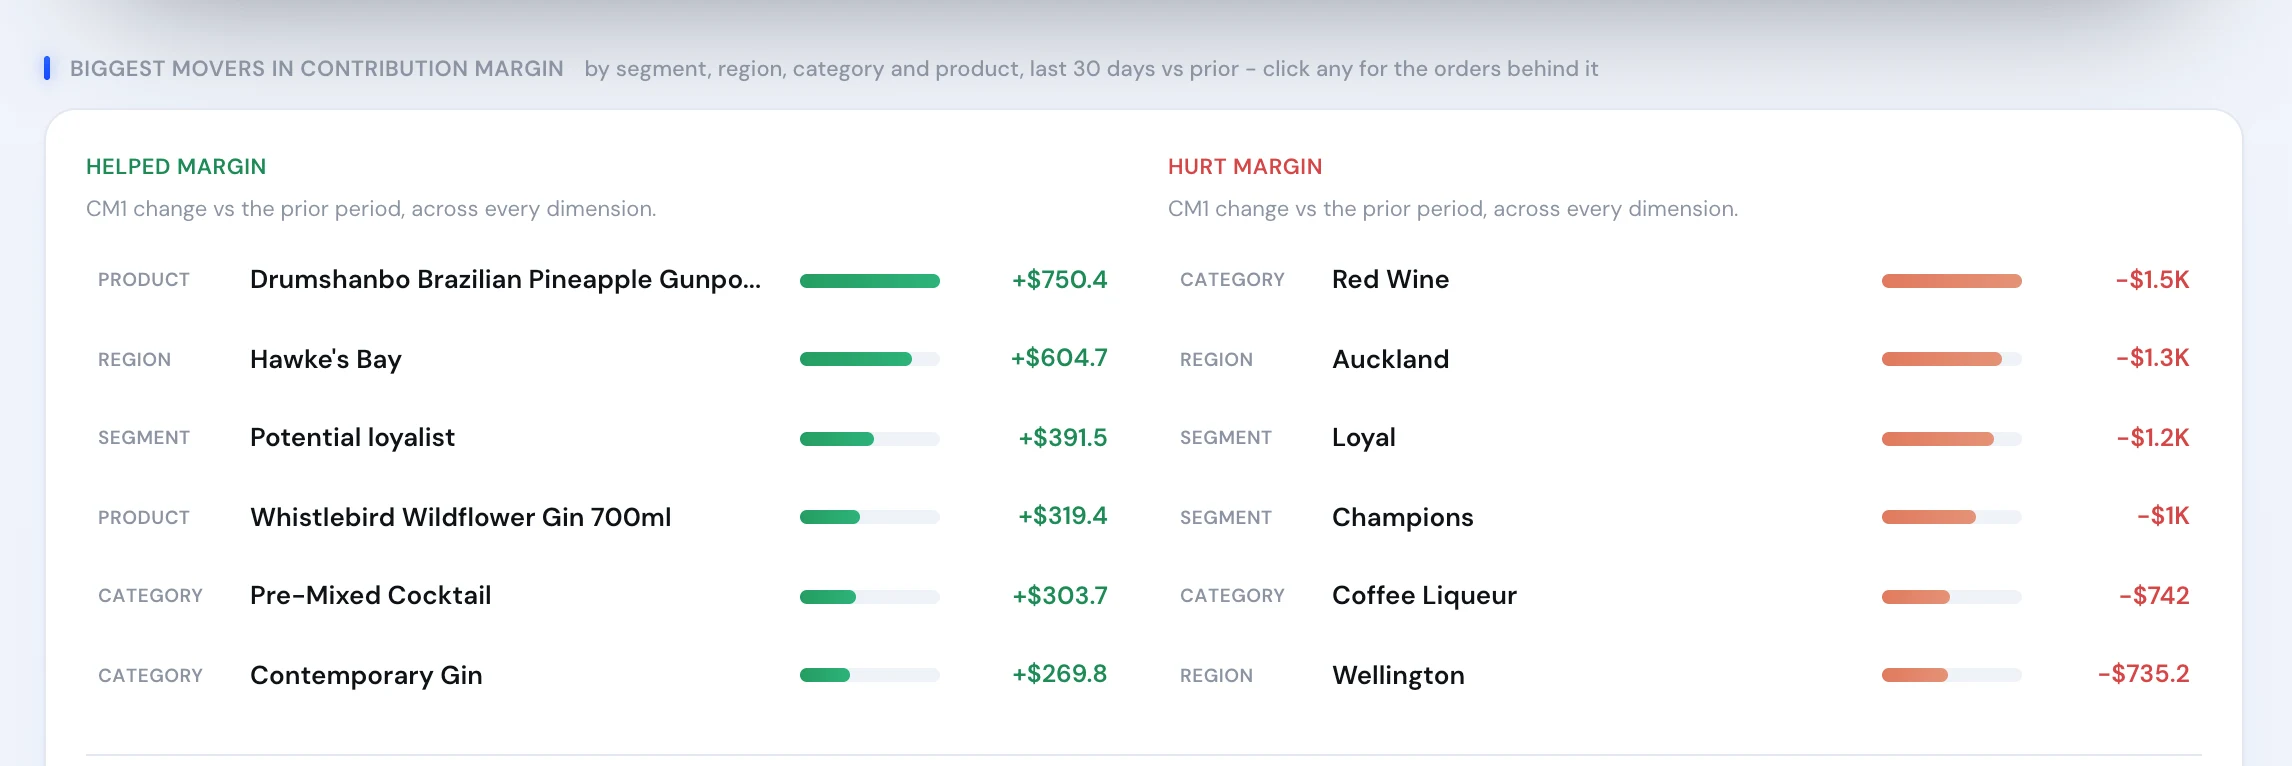
Real product screen, shown on sample data.
The team behind the numbers.
 A$942kin incremental revenue once the double-counted attribution was fixedRead the case study →
“I couldn't be more impressed with the Blufire team and the improvements they have made… working on the account and maximising results daily.”














The decision you walk away with.
Revenue is the headline number, and a record month feels like a good month.
CM1 is the headline, beside revenue, so a record month that kept less is obvious.
The margin squeeze is found at quarter end, when the bank balance disagrees with the sales report.
What Changed shows which product, region or segment took the margin, the same week it happens.
Founder, finance and marketing each argue from their own report.
Each role lens reads the same CM1 figures, ranked for that seat.
Nobody is sure whether a missing cost is zero or just missing.
Data Health shows which connectors are live and which figures rest on a gap.
Where ecommerce profit margin gets misread.
- Stopping at gross margin.Gross margin ignores shipping, fees and ad spend, which are exactly the lines growth inflates. Read contribution margin down to CM3.
- Reading the blended average only.A store-wide margin can hold steady while one channel or category slides. The leak lives in the breakdown; see where margin leaks.
- Comparing percentages without dollars.A point of margin on a bigger revenue base is more money. Always read the dollar change beside the rate.
- Blaming ad spend for everything.In the example above, COGS and shipping took 6 of the 11 lost points before marketing was counted. Check what CAC is paying back too, but fix the cheapest leak first.