Problems we solve / The money / Where margin leaks
Problem 02 of 16 · The moneyWhere exactly is margin made, and where is it leaking?
Every store has a margin number, and almost every store reads it as one figure. But margin is made and lost in the breakdown: a product, a channel, a cohort, a shipping rule. Margin analysis means cutting the number until the line that loses money on every order has nowhere left to hide.
Break contribution margin down by product, channel and cohort at the same time, then step each cut from revenue down through every cost line so you can see which cost did the damage. Blufire's Unit Economics section is that breakdown: a pivotable Profitability Cube, a CM1 Waterfall, and a queue of leaks ranked by the dollars you can recover.
5.0 on Google · 100+ businesses · $153M revenue influenced
Averages are built to hide the thing you are looking for.
A store-wide margin is a weighted average of every order. Strong lines lift it, weak lines drag it down, and the result looks like a healthy middle. A product that loses A$2 on every order sits comfortably inside a 38% average, because the hero products carry it.
Leaks also form at the joins between dimensions, which is why cutting by one dimension at a time rarely finds them. A product can be profitable overall and loss-making through one channel. A channel can be profitable overall and loss-making on first orders. The leak is in the cell, product × channel × customer type, not in the row or the column.
And most leaks are not in COGS. Landed COGS is usually known and stable. The costs that drift are the ones that move with the order after the product is picked: free shipping on a small basket, pick and pack on a low-price item, refunds on a size that runs small, a discount stacked on a bundle. That is why margin analysis has to go past CM1 to CM2 and beyond (the full step-down is on The Math).
The decision you walk away with.
One store-wide margin, checked when the accountant sends it.
Margin by product, channel and cohort, pivoted in one cube.
Leaks are found by accident, usually after a bad quarter.
Every leak sits in a queue, ranked by the dollars you can recover.
Free shipping and refunds disappear inside "operating costs".
The waterfall gives each its own line, between revenue and CM2.
A fix goes live and nobody checks whether it held.
The Recovery Tracker reads what the fix actually returned.
A 38% average with a loss-making line inside it.
A skincare store, one month, read at CM2 (after landed COGS, pick and pack, shipping and payment fees, before any ad spend).
The store-wide 38% looks fine. Cut by product, the minis look weak but positive at 5%. Only when minis are cut by channel and customer type does the leak appear: first orders shipped free through Meta lose A$2 each, and that is before the ads that produced them are counted.
The fix is not to drop the minis, which earn 35% as a repeat add-on. It is to stop shipping them free as a standalone first order, with a threshold or a bundle. The free-shipping threshold calculator prices that change, and the contribution margin calculator checks any line on its own.
Pivot the margin, find the leak, prove the fix.
Section S2, Unit Economics, is one pivotable Profitability Cube: contribution margin by product, channel or cohort, and by any combination of them, so the cell where margin leaks is one pivot away. The CM1 Waterfall steps list revenue down through product discounts, refunds, COGS, fulfilment, payment fees, the free-shipping give and ad spend, so you can see which cost took the margin on the way down.
A cost feed that is not connected shows as an honest zero with a note, never a guessed figure, and lines costed above their selling price are surfaced, not smoothed away. Then the Ranked Leak Queue orders every leak by the dollars recoverable, and the Recovery Tracker keeps checking after the fix, because a leak you found and never re-checked is a leak you still have.
- Profitability CubeContribution margin pivoted by product, channel or cohort, down to the cell where it leaks.
- CM1 Waterfall & bridgeWhat each cost line took on the way from revenue to CM1, CM2 and CM3, and what moved any period's margin.
- Ranked Leak QueueEvery margin leak ordered by the dollars recoverable, so the biggest fix comes first.
- Recovery TrackerHolds each fix accountable by tracking what was actually recovered after it shipped.
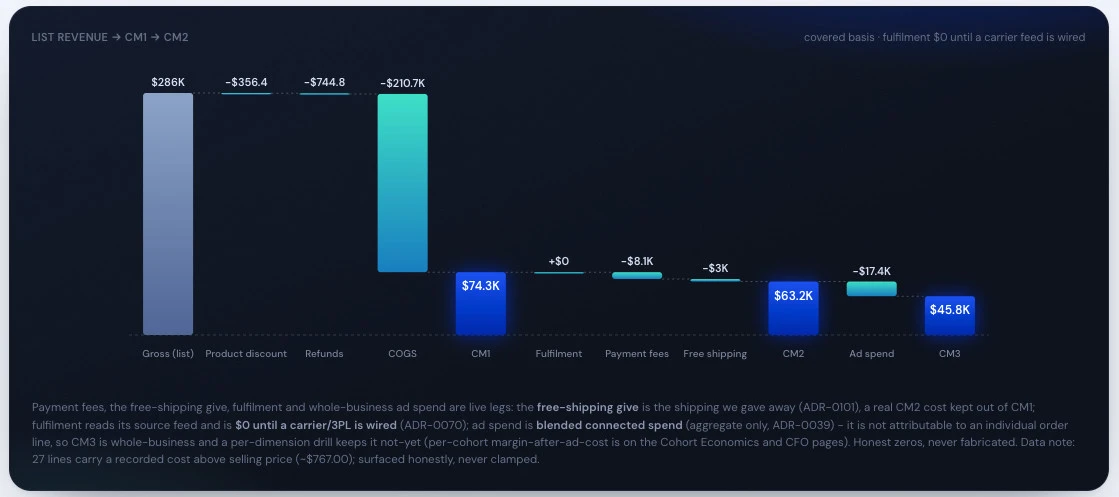
Real product screen, shown on sample data.
The team behind the numbers.
 A$5k to A$170ka month in eight months, with the finish carrying 85% of revenue de-riskedRead the case study →
“They took the time to understand our business and goals, and delivered a clear, customised strategy that actually worked.”














Margin analysis that actually finds leaks.
- Cut two dimensions at once.Product alone and channel alone both averaged the example leak away. Product × channel × new or repeat found it. The contribution margin ratio should be read per cell, not per row.
- Step down past CM1.Shipping, fees and refunds cause most leaks, and all of them sit below CM1. Include the variable costs that move with each order.
- Rank by dollars, not percentages.A −40% line on A$2,000 of revenue matters less than a 5% line on A$60,000 that should be 30%.
- Check returns by line.A product with a high return rate can look profitable at order time and leak weeks later. See what returns are really costing.
- Re-check after the fix.Leaks come back when a carrier rate or supplier price changes. A fix is done when the margin is still there next month.