What's Inside / The operation / S13 Experiments
Conversion lift studies that measure the margin a campaign caused.
A conversion lift study asks the only question attribution cannot: would these sales have happened anyway? The ad platforms offer their own, measured in their own conversions. Section S13 runs the test on your side of the ledger and returns the answer in contribution margin, with the uncertainty attached.
Hold a channel back from a randomly chosen group or region, compare it with the group that saw it, and read the gap in CM1, not platform conversions. Blufire's Experiments section sets up geo-lift tests, email and SMS holdouts and ad-set holdouts, and returns each as a verdict with a confidence interval.
5.0 on Google · 100+ businesses · $153M revenue influenced
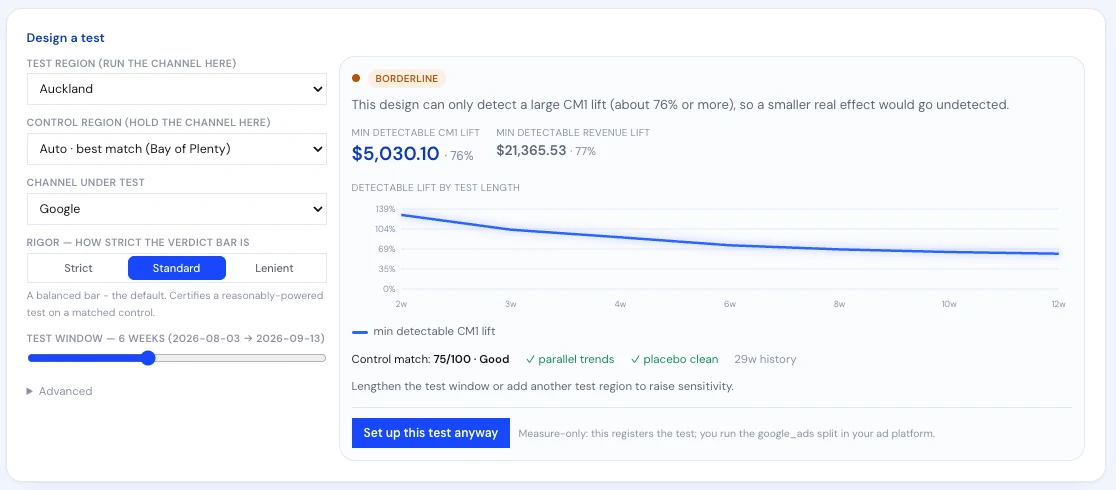
Real product screen, shown on sample data.
Proof of cause, not correlation.
Experiments is where marketing claims get tested. Every other section reads what happened. This one asks what marketing caused, by comparing a group that saw the activity with a matched group that did not, and it reports the result as incremental contribution margin with a confidence interval.
The screen shown is Design a test. You pick a test region, a control region (or let it choose the best match), the channel under test, how strict the verdict bar should be and the test window. Before anything runs, it tells you the smallest CM1 lift the design could detect, charts how that shrinks as the window lengthens, and scores the control match with parallel-trends and placebo checks. A weak design is labelled borderline, with advice on how to strengthen it. Geo tests are measure-only: Blufire registers and reads the test, and you run the split in your ad platform.
“I couldn't be more impressed with the Blufire team and the improvements they have made… working on the account and maximising results daily.”
 A$942kin incremental revenue once the double-counted attribution was fixedRead the case study →










The questions only a controlled test can settle.
- Did that campaign cause new margin?Or would those sales have happened anyway? The full answer is on did it cause margin.
- Is this channel worth what the platform says?A geo-lift test measures it by region, with no user tracking.
- Is this email flow earning, or reaching people who would buy anyway?A holdout test withholds it from a random slice and compares.
- Can I trust the result?Diagnostics and a confidence interval sit beside every verdict.
An ad-set holdout, read in margin with its interval.
A prospecting ad set runs for four weeks. 90% of the eligible audience sees it, 10% is held out at random. The result is measured as CM1 per customer.
The headline says the ad set made A$18,000. The interval says the true answer could be anywhere from losing A$54,000 to making A$90,000. That is not yet a keep. It is a case for a longer window or a larger holdout, which is exactly the trade the Design a test screen shows before you start.
Compare that with what the platform reports. The sources cited on The Math document a Meta test that showed 2.1x true incremental return against 4.8x platform-reported. The gap is why incrementality is read against break-even ROAS, not against the dashboard.
For whoever has to justify the budget.
Performance marketers use it before scaling a channel. A platform will usually credit itself with sales it reached rather than caused, and a platform over-claim is hard to argue with from inside that platform. A geo-lift result in CM1 is a number the finance team can accept.
Retention and CRM teams use the email and SMS holdouts. A flow can look like a top earner in the email platform while mostly reaching people who were going to buy anyway. The holdout separates the two, and the same treatment-against-holdout read sits in the Activation Bridge payback ledger for pushed audiences.
Finance and founders use the test history. Because every test is kept with its diagnostics, next year's budget is argued from a record of what was proven, not from last year's attributed revenue. It also gives the mix model something to be checked against.
From claimed results to proven ones.
Channel value is whatever the platform attributes to itself.
Channel value is the incremental CM1 a controlled test measured.
Tests are run once, and nobody checks if they could detect anything.
The design shows its minimum detectable lift before a dollar is spent.
A result is one number with no uncertainty.
Every verdict carries a confidence interval and trustworthiness diagnostics.
Test results live in old slide decks.
Every test's history is kept on record, next to the section that ran it.