What's Inside / The operation / S11 Planning & Forecasting
Demand forecasting software that forecasts margin and cash, not just sales.
Most demand forecasting software hands you one line: next month's sales. The line is always wrong, it says nothing about margin, and it gives you no way to try a decision before you make it. Section S11 projects revenue, CM1, demand and cash as a range, lets you test the plan, then holds the plan to account.
Forecast as a range, forecast margin and cash alongside revenue, and price every planned change before you commit. Blufire's Planning & Forecasting section draws forecast fans from your own order history, runs COGS, AOV and discount changes in a Scenario Lab, and explains the gap between plan and actual with a CM1 variance waterfall.
5.0 on Google · 100+ businesses · $153M revenue influenced
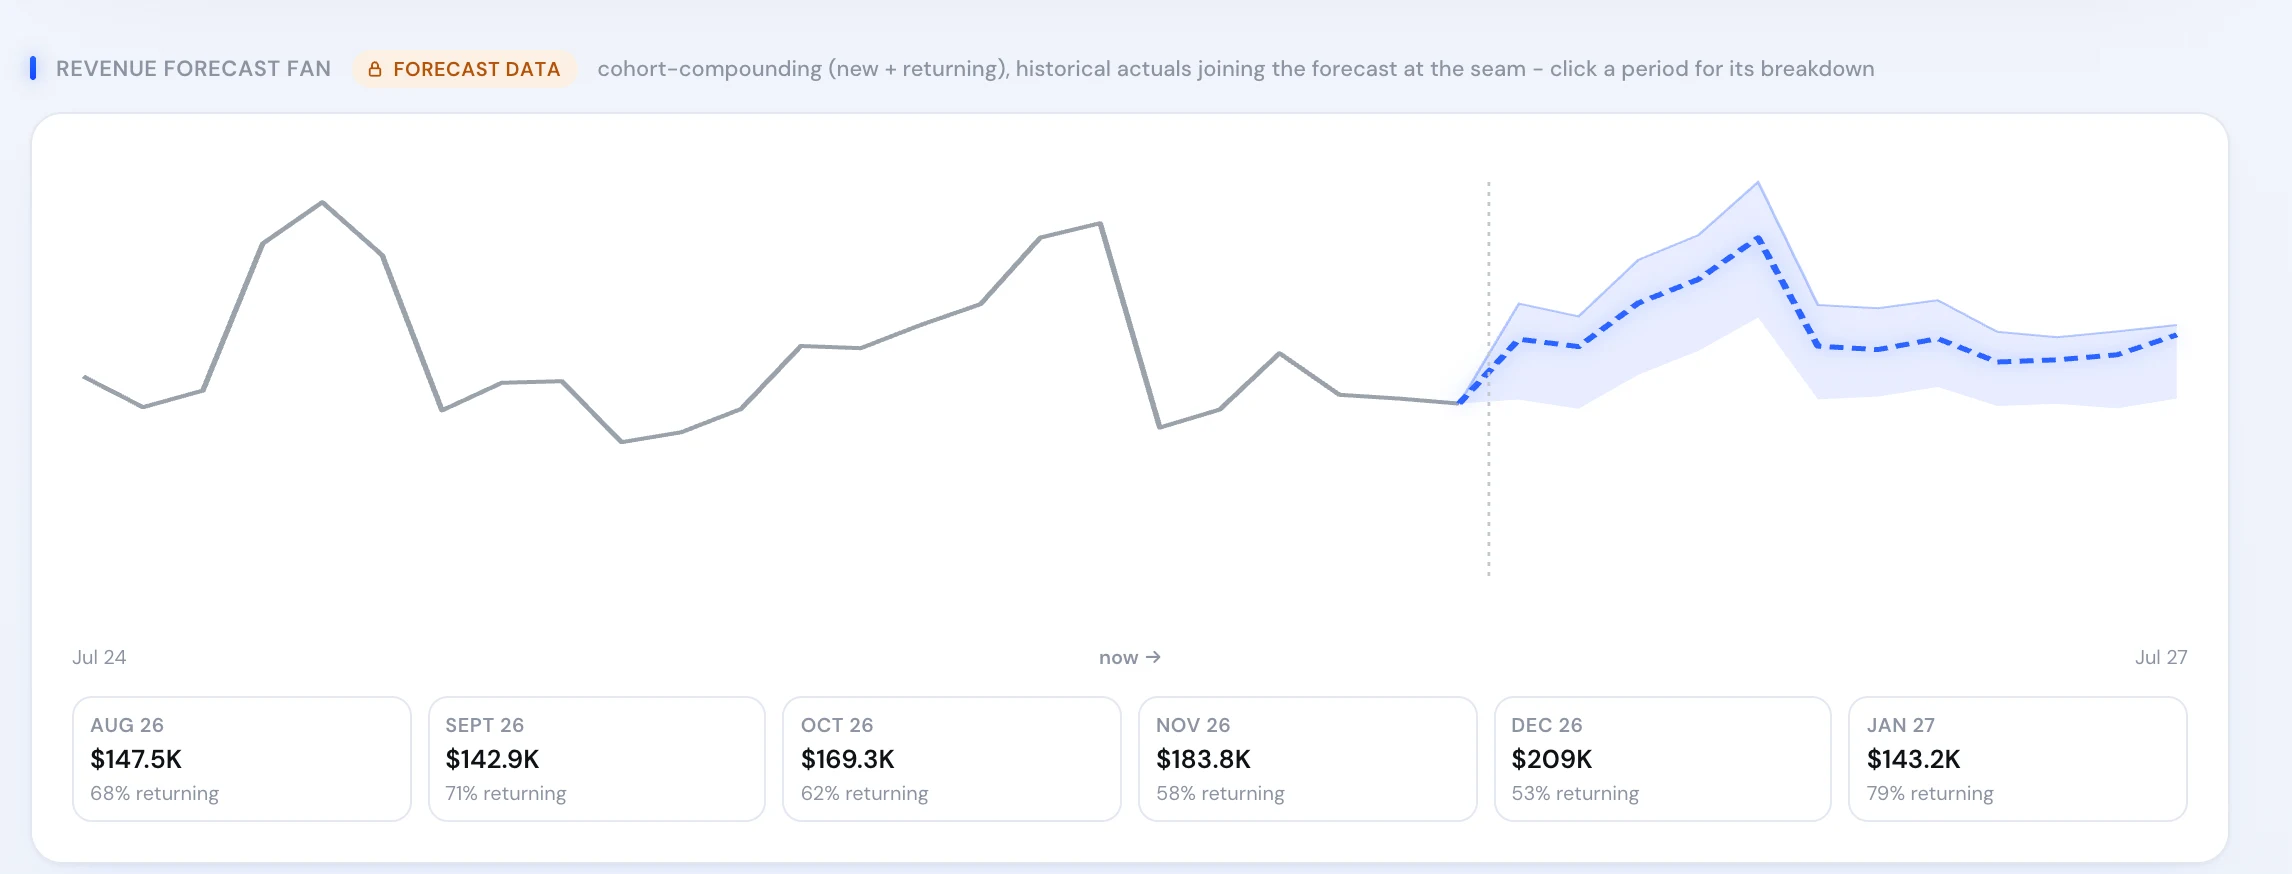
Real product screen, shown on sample data.
Project it, test it, then track it.
Planning & Forecasting projects revenue, margin, demand and cash forward from the same reconciled data every other section reads. The forecast is drawn as a fan, a central line inside a shaded band, because a plan built on a single number has no room for being wrong.
The screen shown is the Revenue Forecast Fan. Historical actuals join the forecast at a seam marked "now", and the forecast is cohort-compounding: it builds the future from new and returning customers separately, so each month card carries its projected revenue and the share expected from returning buyers. Click any period for its breakdown.
“Quick to take action, and bring a lot of experience… a partner who can strategically execute and adapt to fast-paced industries.”












Why the band matters more than the line.
One SKU, one month. It sells at A$60, costs A$25 landed, and earns A$35 of CM1 per unit. The fan puts November demand at 800 units, inside a band of 680 to 920.
The two misses are not the same size or the same kind. Under-buying loses A$4,200 of margin for good. Over-buying parks A$3,000 of cash in stock that can still sell next month. A single-line forecast hides that trade. The band puts it on the table, so the buy can lean toward the side you can afford.
The answer changes with the margin. On a thin-margin SKU the missed-sale cost shrinks and the carrying cost dominates. That is why the forecast is read in CM1 and cash, and why the resulting quantities feed the reorder view in Products / Inventory.
What a planning meeting actually needs to know.
- What will next quarter look like?Revenue, CM1, demand and cash, each as a range. The full walk-through is on forecast and test the plan.
- Can we afford the plan?Operating cash flow and working capital projected alongside the sales it assumes.
- What happens if we change the price, the discount or the supplier cost?Run it in the Scenario Lab first. This is scenario analysis on your own numbers.
- Why did we miss?The CM1 variance waterfall splits the gap into the lines that caused it.
From a sales guess to a plan with receipts.
One forecast line, in revenue, built in a spreadsheet.
Revenue, CM1, demand and cash, each drawn as a fan with a band.
Cash surprises show up in the bank account.
Operating cash flow and working capital are projected with the sales plan.
A price or discount change is decided in the meeting.
The change is priced in the Scenario Lab before anyone commits to it.
A miss is reported as a number: 8% under plan.
The CM1 variance waterfall shows which lines caused the miss.
One plan, read by the people who have to hit it.
Finance uses the cash and working-capital projections to see whether the plan can be funded, and Plan-vs-Actual to report the quarter. When the variance waterfall shows a miss came from deeper discounting rather than lower volume, the conversation in the board meeting changes.
Operations and buying teams use the demand fans to size purchase orders. Marketing uses the CM1 efficiency frontier to see where each channel's payback and breakeven sit before the budget is set, which is the same break-even logic the rest of the product runs on.
Founders use the Scenario Lab. A supplier price rise, a smaller discount or a higher order value can be tried on the model first, so the decision is made on its margin effect rather than on a guess. When a question needs a full model, such as how price moves volume, the Financial Models section runs price elasticity on your own data.