What's Inside / The operation / S12 Financial Models
Marketing mix modeling, price elasticity and GMROI, run on your own data.
The classic ecommerce financial models are well known and rarely run, because each one needs clean data, a spreadsheet and someone who trusts the formula. Section S12 runs them on your store's reconciled data and shows the working: the inputs, the formula and the records behind every answer.
Run marketing mix modeling, price elasticity, cohort LTV, customer equity and GMROI on the same reconciled margin data, and judge every output in contribution margin. Blufire's Financial Models section does that and exposes each model's inputs, formula and underlying records, so the answer can be checked rather than taken on trust.
5.0 on Google · 100+ businesses · $153M revenue influenced
Real product screen, shown on sample data.
The textbook models, with the working shown.
Financial Models is the section for questions that need a model rather than a report: what each channel really contributed, what a price rise does to margin, whether a SKU earns its stock. Each model runs on your data and reads in the same CM1 as the rest of the product.
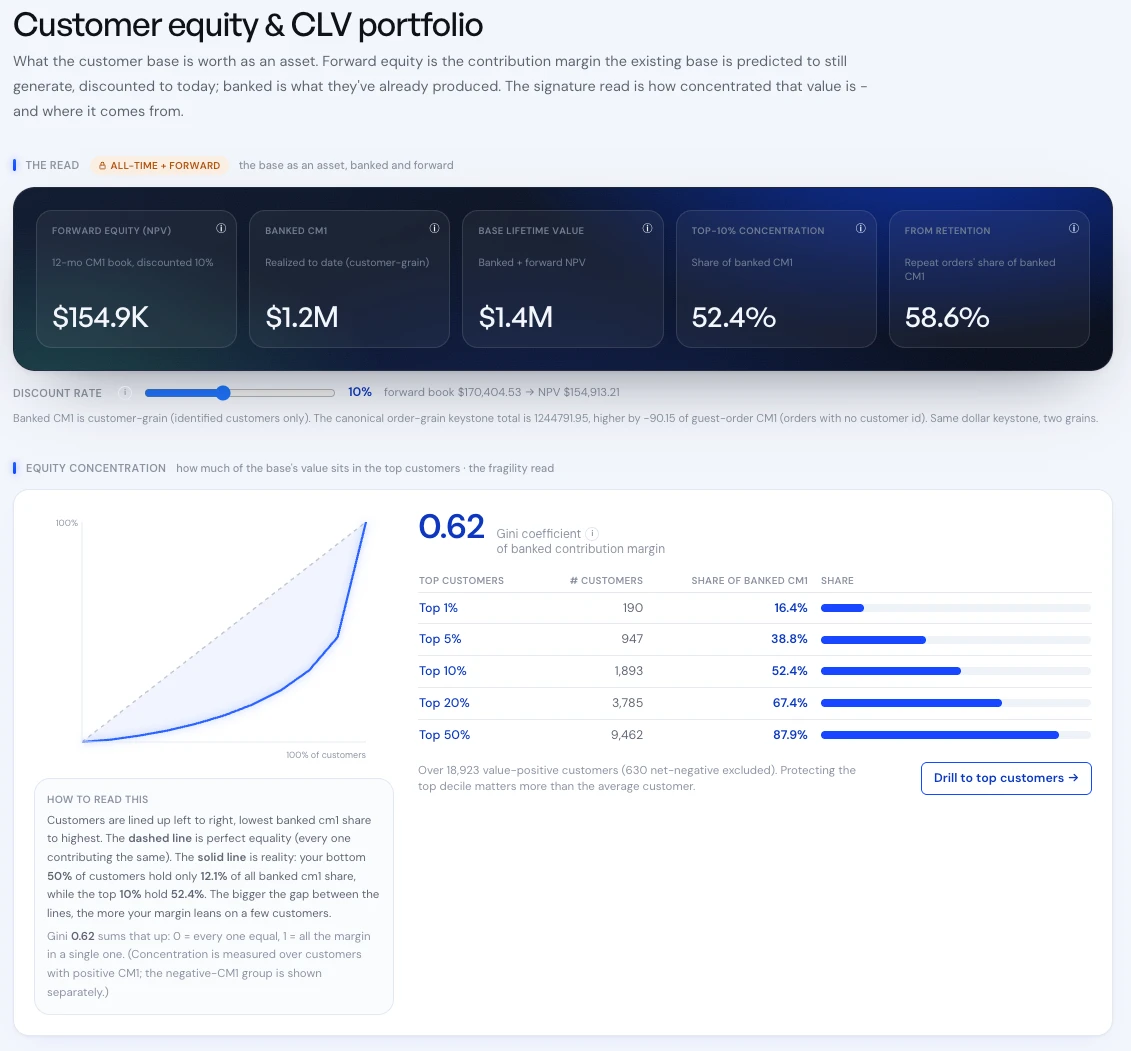
The screen shown is Customer Equity & CLV Portfolio. It values the base two ways: banked CM1, what customers have already produced, and forward equity, the contribution margin the existing base is predicted to still generate, discounted to today at a rate you can adjust. It then shows how concentrated that value is, as a curve, a Gini coefficient and the share held by the top 1% to 50% of customers, with a drill to the customers themselves.
“They're experts in their field and genuinely seem to care about us winning… they achieve all the results we could hope for where it matters.”
 89 enquiriesat A$89 each in three months, scored and fed straight to dealersRead the case study →










For the people who have to defend the number.
Finance and founders use the section when a decision needs more than a trend line. A price rise is judged on elasticity and contribution, not a hunch. A buying budget is set from GMROI and open-to-buy, so capital goes to the SKUs that return the most margin per dollar of stock.
Marketing leads use the mix model when platform dashboards disagree, which they do: the sources cited on The Math put Meta at roughly 26% above third-party analytics on average. A model built on aggregate sales and spend is a second opinion that needs no pixel, read beside the attribution comparison.
Customer equity answers what the base is worth beyond this month's sales. When banked margin sits with a small group, protecting that group matters more than lifting the average.
From a model you have heard of to one you have run.
Marketing mix modeling is a project nobody has the data or time to run.
The mix model runs on your own sales and spend data, in the same margin terms as everything else.
Price changes are set by feel or by competitor pages.
Price elasticity on your own products shows what a move does to volume and CM1.
Stock budget is last year's plus a percentage.
GMROI and open-to-buy show which SKUs earn their capital and how much budget is left.
Customer value is one average LTV.
Customer equity values the whole base, banked and forward, and shows how concentrated it is.
One model per question.
| Model | The question it answers |
|---|---|
| Marketing mix modeling | How much did each channel contribute, beyond what its tracking claims? |
| Price elasticity | What does a price move do to units sold, and to contribution margin? |
| Cohort LTV | What is each acquisition cohort worth over its life, in margin? |
| Customer equity | What is the whole base worth, banked and forward, and how concentrated is it? |
| GMROI | How much gross margin does each dollar of inventory earn? |
| Open-to-buy | How much stock budget is left to commit this period? |
These models sit behind the forecast. The planning question they feed is what next quarter looks like, and whether the plan survives testing.
A marketing mix model, finished in margin.
A year of weekly sales, modelled into a baseline and each channel's contribution. The store earns a 55% contribution margin before ad spend, so its break-even ROAS is 1 ÷ 0.55, about 1.82x.
Both channels clear break-even, by different distances. Meta's 2.0x sits just above 1.82x and leaves A$30,000. Google's 2.5x leaves A$75,000 on less spend. A revenue-only read would call them both "working". A margin read says the next dollar belongs to Google until its own returns start to fall.
The model is only as good as its check. A mix model's channel estimates should survive a controlled test, which is what the Experiments section runs. Try the threshold on your own margin with the break-even ROAS calculator.