What's Inside / The marketing / S6 Marketing / Channels
Blended ROAS, rebuilt on margin and split by channel
Blended ROAS is the honest cousin of platform ROAS: total revenue over total spend, no double counting. But it still counts revenue, not margin, and it cannot tell you which channel is carrying the rest. Section S6, Marketing / Channels, reads the same blend in CM1 and breaks it apart.
Replace blended ROAS with blended CM1-MER, contribution margin over total spend, then decompose it into each channel's share. Blufire's Channels section does that, and adds what each channel's customers become after their first order.
5.0 on Google · 100+ businesses · $153M revenue influenced
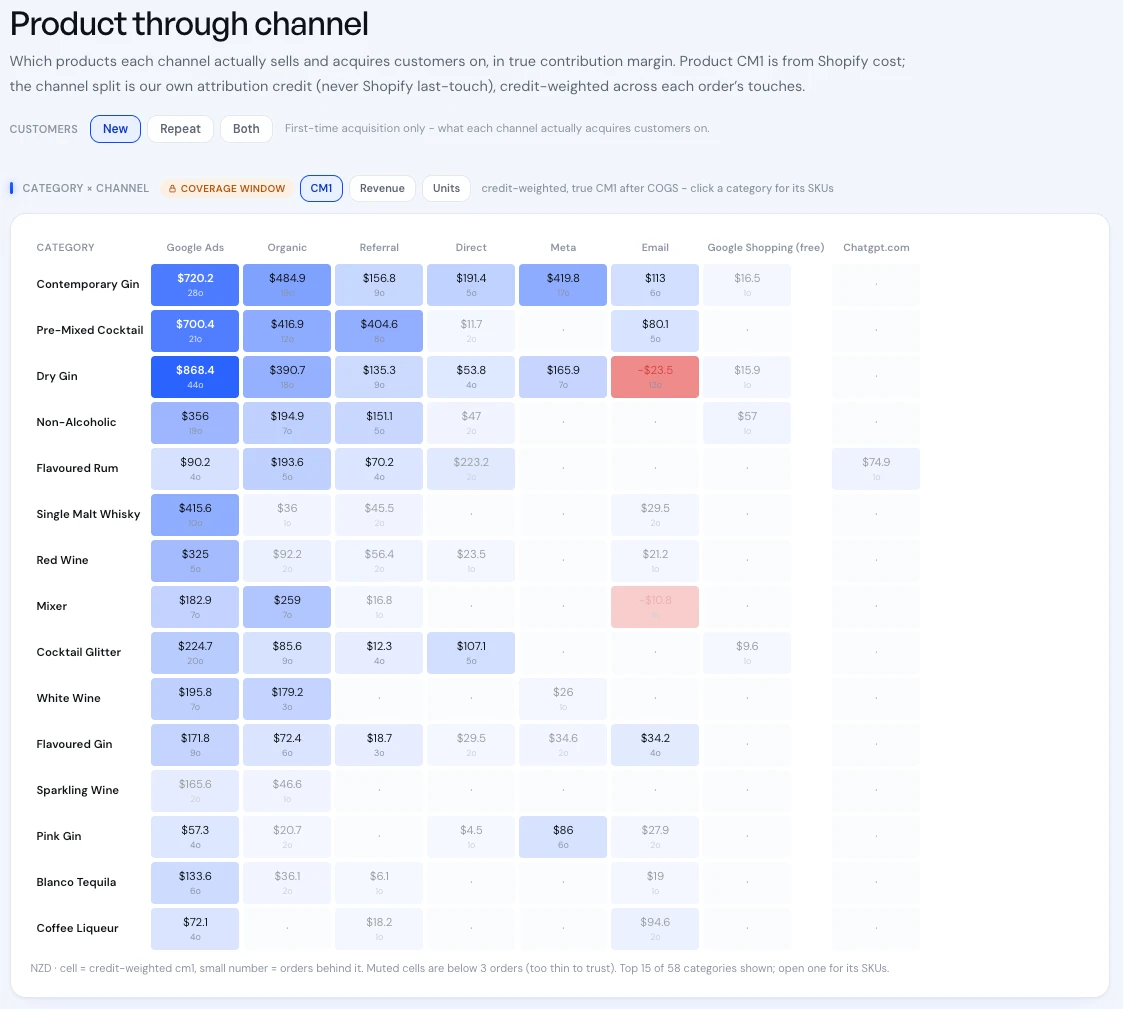
Real product screen, shown on sample data.
Section S6: channel, customer and product in one CM1 view.
S6 holds channel x customer x product in one table, priced in contribution margin rather than platform ROAS. Channel credit comes from the published source map in Acquisition, credit-weighted across each order's touches, never Shopify last touch.
The Product through channel view shows which categories each channel actually sells and acquires customers on, in CM1. Toggle new, repeat or both. In the screen, a Dry Gin cell under Email reads negative CM1 while the same category is the strongest cell under Google Ads. Cells built on fewer than three orders are muted, because they are too thin to trust.
“They're experts in their field and genuinely seem to care about us winning… they achieve all the results we could hope for where it matters.”












What S6 answers that blended ROAS cannot.
- Which channel is actually profitable once real margin is counted?The whole of the profitable channel problem, answered in CM1-MER per source.
- Is a cheap channel really cheap?A low CAC that brings one-order customers is not cheap. Per-source profiles show repeat behaviour next to acquisition cost.
- Which products does each channel move?The SKU x channel matrix shows where a channel sells full-margin lines and where it only moves a low-margin category.
- How do email flows compare with campaigns?Owned channels sit in the same CM1 view as paid, so flows and campaigns are judged on the same margin.
A 4.0x blended ROAS, read in margin.
One month: A$200,000 revenue on A$50,000 total ad spend. CM1 is 55% of revenue. The blend looks strong. Now decompose it.
At 55% CM1, the revenue break-even is 1 ÷ 0.55, about 1.82x, so a 4.0x blend looks comfortable. In margin, the last A$5,000 keeps A$0.40 per dollar before shipping, fees and returns, which may be nothing at all. The blend averaged it away.
Blended numbers are still the right starting point, because they cannot be double counted the way platform numbers are. The fix is to keep the blend and change the numerator to margin. Set a target with the target MER calculator, and see ROAS formula for why revenue ratios mislead.
For the person deciding where the next dollar goes.
Growth leads and media buyers use the Channel Read to move budget between sources on margin, and the SKU x channel matrix to stop pushing a category through a channel that sells it at a loss. Founders use blended CM1-MER as the one number that says whether total marketing is paying, without trusting any platform.
Retention and email managers use the same view to see flows next to campaigns and paid, so an owned send that only moves discounted volume shows up as clearly as a weak ad set. Anyone checking acquisition cost can cross to Unit Economics for each channel's blended CAC and payback.
Channel reporting today, and with S6.
Blended ROAS says 4.0x and the meeting moves on.
Blended CM1-MER says 2.2x, and each channel's share of it is on screen.
Each platform reports its own revenue, which adds up to more than you made.
Channel credit comes from one published source map, weighted across real touches.
A channel is judged on its first order.
Per-source profiles show what its customers become after the first order.
Products and channels are reported separately.
The SKU x channel matrix shows which products each channel sells at a profit.