Three subtractions, in a fixed order.
Every rung subtracts one family of variable costs. The order matters: each line is the pool the next cost has to be paid from.
| Term | What it means |
|---|---|
| Net revenue | Gross sales less discounts, refunds and returns. |
| Landed COGS | Supplier cost plus freight-in plus duty. See landed COGS for what belongs in it. |
| Fulfilment, shipping & payment fees | Pick-pack, packaging, outbound postage, free-shipping subsidies and the processor's cut on each order. |
| Variable marketing | Ad spend, affiliate commission and promo cost that scale with orders. Salaried marketers and fixed retainers sit below CM3 with fixed costs. |
One A$120 frame set, stepped down.
The lens retailer from The Math, per order. The numbers are exactly as published there.
Read it rung by rung. At 58% the product carries its cost comfortably. Operations take 13 points, which is normal: for most DTC brands CM2 sits 10 to 15 points below CM1 (per the framework cited on The Math). Acquisition then takes 22 points, and the order contributes A$27.60 towards rent and salaries.
CM2 is also the line that sets your ad ceiling. Break-even ROAS here is 1 ÷ 0.45, about 2.22x. The ROAS formula page works that through.
A month of the same store, as a full statement.
Scaling the step-down from one order to a period, and adding the fixed-cost line underneath. Same 58% CM1, heavier marketing month.
Same CM1 as the single order, but CM3 lands at 17.2% instead of 23% because marketing took 28% of revenue. A traditional statement would bury those six extra points of marketing in "operating expenses". Here it is one line, and it points at one owner.
The CM3 line is also what your break-even analysis divides into fixed costs, and what the contribution margin ratio expresses as a percentage.
Traditional versus contribution format.
Both statements reach the same bottom line. They group the costs differently on the way down.
| Traditional income statement | Contribution margin income statement | |
|---|---|---|
| Costs grouped by | Function: cost of sales, then operating expenses | Behaviour: variable first, fixed last |
| Shipping and payment fees | Usually buried in operating expenses | Above the line, at CM2 |
| Ad spend | One marketing line, mixed with retainers and tools | Variable spend at CM3, fixed marketing below it |
| Headline subtotal | Gross profit | CM1, CM2 and CM3 |
| Question it answers | Did we make money this period? | Does the next order make money, and which cost decides it? |
Build one from your own books with the Shopify P&L template, which keeps a visible contribution line before fixed costs.
The same statement, rebuilt every week from the orders.
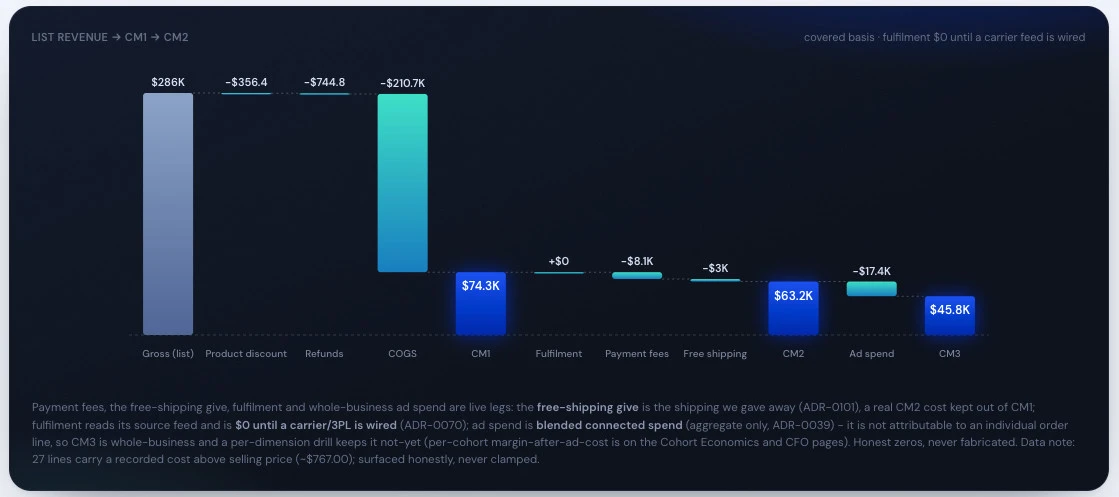
Section S2, Unit Economics, runs this step-down on every order, customer and SKU, and reconciles it against your ledger. The CM waterfall walks gross list revenue through product discounts, refunds and COGS to CM1, then fulfilment, payment fees and the free-shipping give to CM2, then ad spend to CM3.
The note under the waterfall says which lines are live and which read zero until a carrier or 3PL feed is connected. A missing cost is shown as missing, never quietly filled with a number that flatters the margin.
- CM waterfall & bridgeTraces any period's margin move line by line, from gross revenue down to CM3.
- Profitability CubePivots contribution margin by product, channel or cohort to see where it is made and where it leaks.
- Ranked Leak QueueOrders every margin leak by the dollars recoverable.
- Recovery TrackerHolds each fix accountable, so a leak you found gets checked again.
Real product screen, shown on sample data.
Where contribution statements go wrong.
- Putting shipping in overheads.Carriers bill monthly, but the cost scales per parcel. Leave it below the line and CM2 is missing its biggest input.
- Splitting marketing on who paid it, not how it behaves.Performance spend is variable and belongs at CM3. An agency retainer is fixed and belongs below it, even though both sit in the marketing budget.
- Allocating fixed costs per order.Spreading rent across orders changes the per-order figure every time volume moves, and hides whether the next sale pays. Keep fixed costs as one line under CM3.
- Reading only the store total.A healthy blended CM3 can carry SKUs that lose money on every sale. Run the statement per product and per channel too, which is where margin leaks hide.
“They're experts in their field and genuinely seem to care about us winning… they achieve all the results we could hope for where it matters.”
 A$5k to A$170ka month in eight months, with the finish carrying 85% of revenue de-riskedRead the case study →
5.0 on Google · 100+ businesses · $153M revenue influenced