Fixed costs over what each order contributes.
| Term | What it means |
|---|---|
| Fixed costs | The monthly bill that does not move with orders: rent, salaries (the owner's included), software, insurance. See fixed costs. |
| CM per order | Average order value minus every variable cost on the order, stepped down to CM3 as shown on CM1, CM2 and CM3. |
| CM ratio | CM per order ÷ average order value. The contribution margin ratio page covers why mix moves it. |
| Margin of safety | (Actual orders − break-even orders) ÷ actual orders. How far volume can fall before the month loses money. |
The break-even point glossary entry defines the term. This page goes further: the margin of safety, the orders needed for a profit target, and which inputs move the line.
One input at a time, from the same base.
Each row changes one input and holds the rest. Payment fees are held flat for simplicity.
| Change | CM per order | Fixed costs | Break-even orders | vs base |
|---|---|---|---|---|
| Base case | A$27.60 | A$26,500 | 961 | n/a |
| A$10 off every order | A$17.60 | A$26,500 | 1,506 | +545 |
| New hire at A$6,000 /mo | A$27.60 | A$32,500 | 1,178 | +217 |
| Freight up A$2 per order | A$25.60 | A$26,500 | 1,036 | +75 |
| Price up A$5 per order | A$32.60 | A$26,500 | 813 | −148 |
Demonstrative numbers. A discount is the most expensive move on the list because it comes straight off contribution, the denominator. Price the next promo with the discount impact calculator before it runs.
Break-even, margin of safety and a profit target.
The A$120 lens order from The Math, which contributes A$27.60 at CM3 (23%), against A$26,500 of monthly fixed costs. The store currently does 1,300 orders a month.
Always round break-even up: 960 orders leaves the month a few dollars short. Every order above 961 adds A$27.60 of profit, which is why a target profit is just more fixed costs to cover: add it to the numerator.
A 26% margin of safety means a quarter of volume can disappear before the month goes red. Check yours with the break-even units calculator.
Is ad spend fixed or variable in your break-even?
Example 1 treats ad spend as variable: A$26.40 per order, scaling with volume. Many stores set a flat monthly budget instead. Then it belongs with fixed costs, and the denominator becomes CM2, which is A$54.00 on the same order.
Neither answer is wrong. They describe different spending habits. If you scale spend to hold cost per order, use CM3 and the variable view. If the budget is set in advance and orders fall where they fall, use CM2 and treat the budget as fixed. Mixing them, by taking ad spend off at CM3 and adding the budget to fixed costs, counts marketing twice.
For the per-campaign version of this question, the break-even ROAS floor is 1 ÷ CM2. The ROAS formula page works it through.
Break-even that updates when the inputs do.
Break-even is only as good as the contribution per order under it, and that number moves every time freight, fees, discounts or mix move. Section S2, Unit Economics, computes it on every order from the ledger, so the denominator is current rather than last quarter's guess.
Section S11, Planning & Forecasting, then works forward. The revenue forecast fan joins historical actuals to a forecast range, month by month, with the share expected from returning customers. The Scenario Lab prices a COGS, AOV or discount change before you commit to it, which is the table above run on your own numbers.
- Forecast fansRevenue, CM1, demand and cash projected ahead as a range, not a single line.
- Scenario LabStress-tests COGS, AOV or discount moves before you make them.
- CM1 efficiency frontierMaps each channel's payback and breakeven.
- Plan-vs-ActualTracks the quarter with a CM1 variance waterfall, so a miss is explained.
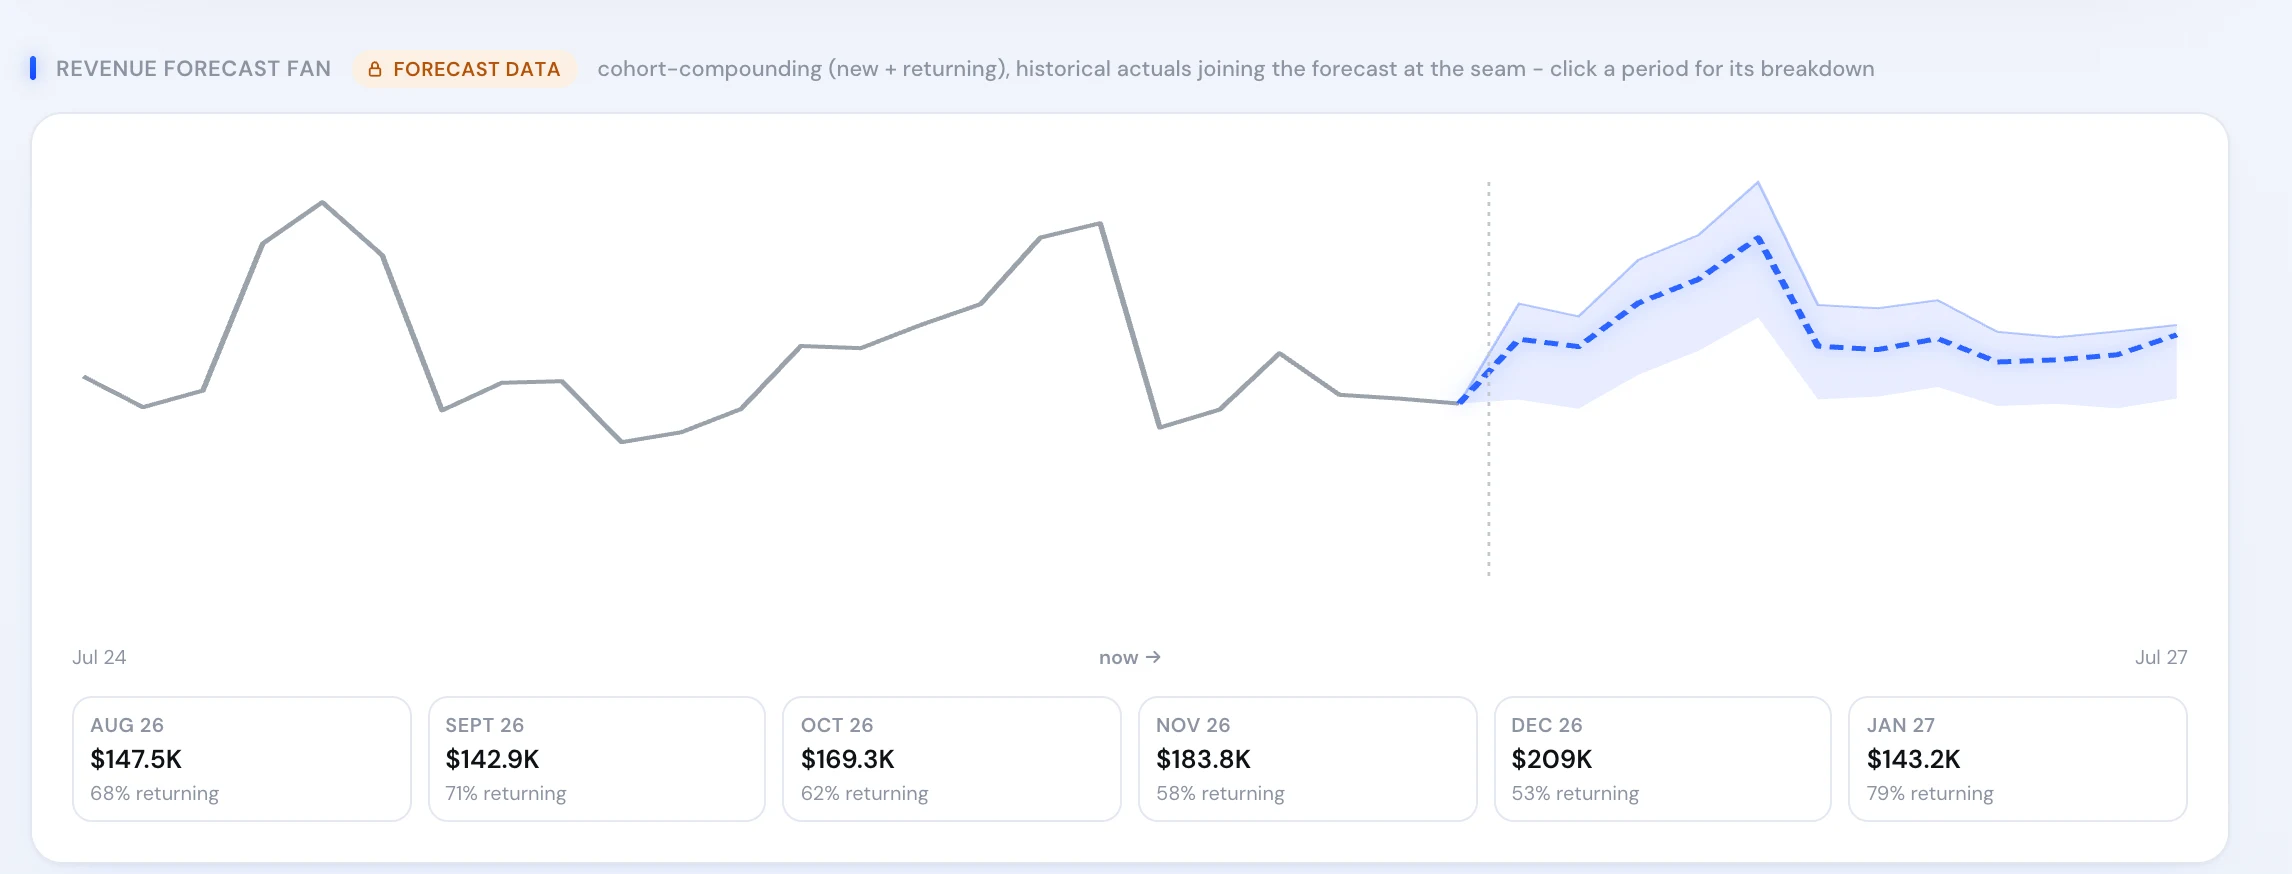
Real product screen, shown on sample data.
Where break-even analysis goes wrong.
- Dividing by gross margin.Gross margin skips fulfilment, fees and marketing, so it overstates contribution per order and understates the orders you need.
- Leaving out the owner's salary.A store that only breaks even because nobody is paid has not broken even.
- Counting marketing twice, or not at all.Decide whether ad spend is variable (in CM3) or fixed (in the numerator). Pick one, as example 2 shows.
- Running it once a year.A freight quote, a fee change or a heavy promo month moves the line. Recalculate monthly and before any decision that adds fixed cost.
“Quick to take action, and bring a lot of experience… a partner who can strategically execute and adapt to fast-paced industries.”
 89 enquiriesat A$89 each in three months, scored and fed straight to dealersRead the case study →
5.0 on Google · 100+ businesses · $153M revenue influenced