One division, with the rung stated.
| Term | What it means |
|---|---|
| Net revenue | Sales after discounts, refunds and returns, for an order, a SKU or a period. |
| Variable costs | Every cost that moves with the order, up to the rung you are measuring. The full list is on variable costs. |
| The rung | CM1 removes landed COGS only; CM2 also removes fulfilment, shipping and payment fees; CM3 also removes variable marketing. The step-down is worked in full on CM1, CM2 and CM3. |
The ratio is the dollar figure from the contribution margin glossary entry, divided by revenue. Its use is prediction: at a 45% ratio, each extra A$1 of sales adds 45 cents to the pool that pays for marketing and overheads, as long as the mix and the price hold.
Three ratios from one A$120 order.
The lens retailer's A$120 frame set from The Math, read at each rung. Every ratio is correct. Each answers a different question.
| Rung | Ratio | Use it for |
|---|---|---|
| CM1 (A$69.60 ÷ A$120) | 58.0% | Pricing and sourcing: can the product carry its landed cost? |
| CM2 (A$54.00 ÷ A$120) | 45.0% | The ad ceiling: break-even ROAS is 1 ÷ 0.45, about 2.22x |
| CM3 (A$27.60 ÷ A$120) | 23.0% | Covering overheads: break-even revenue is fixed costs ÷ 0.23 |
Demonstrative numbers, as published on The Math. Using the CM1 ratio where the CM2 ratio belongs sets an ad floor that is too easy to clear.
The store ratio is a weighted average, so mix moves it.
Two products, one month, ratios measured at CM2. Then the same total revenue with the mix flipped.
Revenue did not move and neither product's ratio changed, yet the store earned A$6,000 less. The simple average of the two ratios is 30% in both months, which is why averaging percentages is a trap: always divide total contribution by total revenue.
This is how a store ends up with revenue up and no more profit: growth arrives in the low-ratio products. Checking the ratio per SKU and per channel is the only way to catch it early.
What 20% off does to the ratio.
An A$100 order with A$42 landed COGS and A$13 of fulfilment, shipping and fees, measured at CM2. Costs are held flat for simplicity; in practice payment fees fall a little with the price.
Price fell 20%. Contribution per order fell 44%, because every dollar of discount comes straight off the margin while the costs stay put. To stand still the promo has to lift orders by 80%. Test your own discount in the discount impact calculator, and see how codes are scored on the discount codes page.
Where the ratio gets misread.
- Quoting it without the rung."Our margin is 45%" means nothing until you say CM1, CM2 or CM3. Two people comparing different rungs will argue about a number they both calculated correctly.
- Averaging percentages.The store ratio is total contribution over total revenue. A simple average of product ratios ignores how much each one sold.
- Dividing by gross sales.Discounts and refunds come off revenue first. A ratio on gross sales flatters every product that sells on promotion.
- Confusing it with markup.Markup divides by cost; the ratio divides by price. A 100% markup is a 50% CM1 ratio. The margin vs markup calculator converts between them.
The ratio by product and by channel, not just the store total.
The mix effect in example 1 only shows up when contribution is split by what sold and where it sold. Section S6, Marketing / Channels, holds channel, customer and product in one CM1 view. The product through channel matrix shows each category's credit-weighted CM1 per channel, with a switch between CM1, revenue and units, so the two sides of the ratio sit one click apart.
Cells with too few orders behind them are muted rather than shown as confident numbers, and it can be filtered to new customers only, to see what each channel acquires customers on.
- SKU x channel matrixWhich products travel through which channels, read in CM1.
- Channel ReadPrices every source in CM1-MER: contribution margin over spend, not platform ROAS.
- Channel Master TableChannel x customer x product in one view.
- Per-source customer profilesWhat each channel's buyers become after the first order.
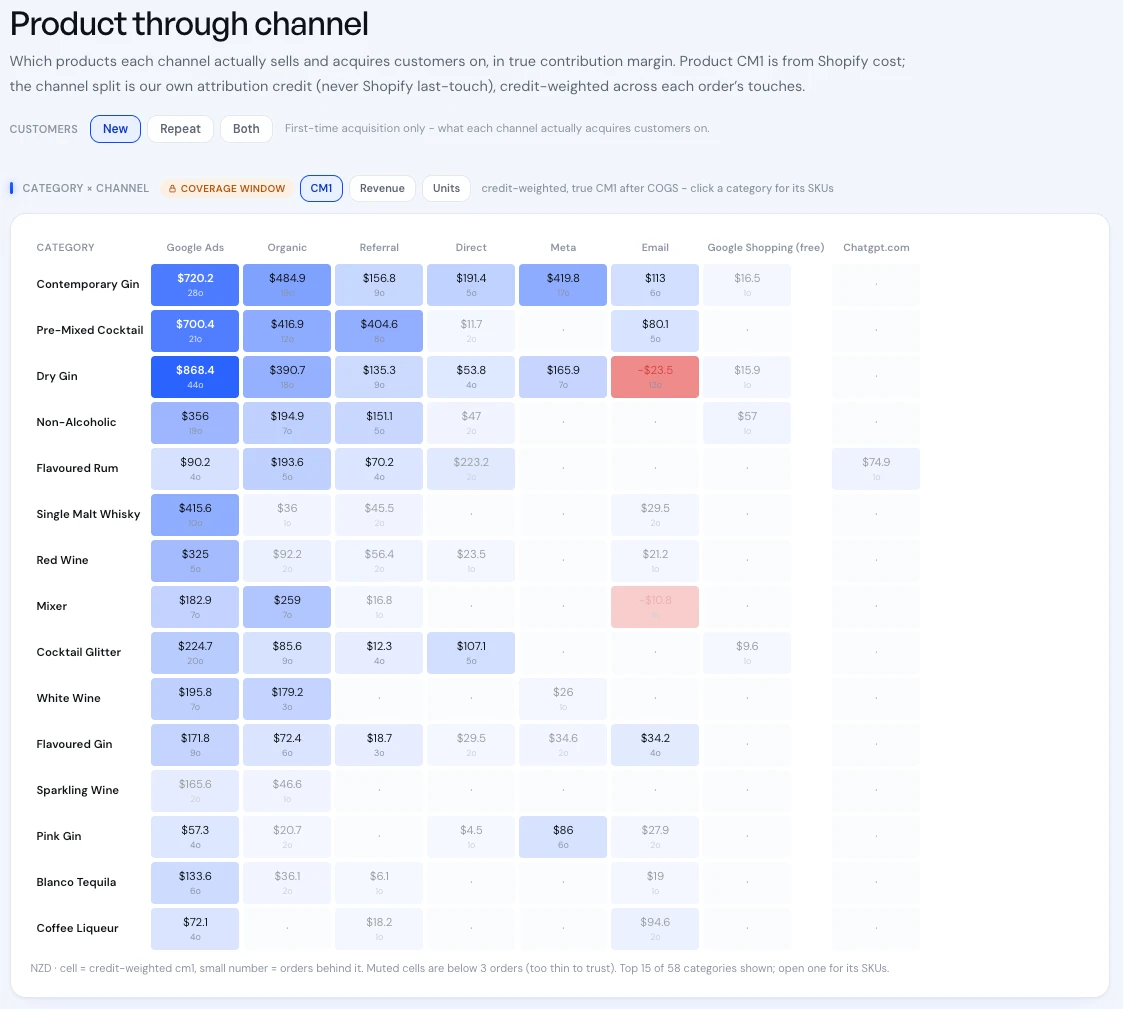
Real product screen, shown on sample data.
“They took the time to understand our business and goals, and delivered a clear, customised strategy that actually worked.”
 A$0 to A$1Min under 12 months, in one of retail's most price-brutal categoriesRead the case study →
5.0 on Google · 100+ businesses · $153M revenue influenced