What's Inside / The marketing / S5 Acquisition (Attribution)
Multi-touch attribution that compares the models instead of trusting one
Meta, Google and Klaviyo each count the same order as their own. Most multi touch attribution tools answer that by swapping one model for another. Section S5, Acquisition (Attribution), runs the models side by side, checks every claim against the margin that actually arrived, and publishes one answer the whole business reads.
Credit each touch on a customer's real path with a share of the order's contribution margin, compare what each model says, then freeze one first-purchase source per customer. Blufire's Acquisition section does all three, so every other report argues from the same map.
5.0 on Google · 100+ businesses · $153M revenue influenced
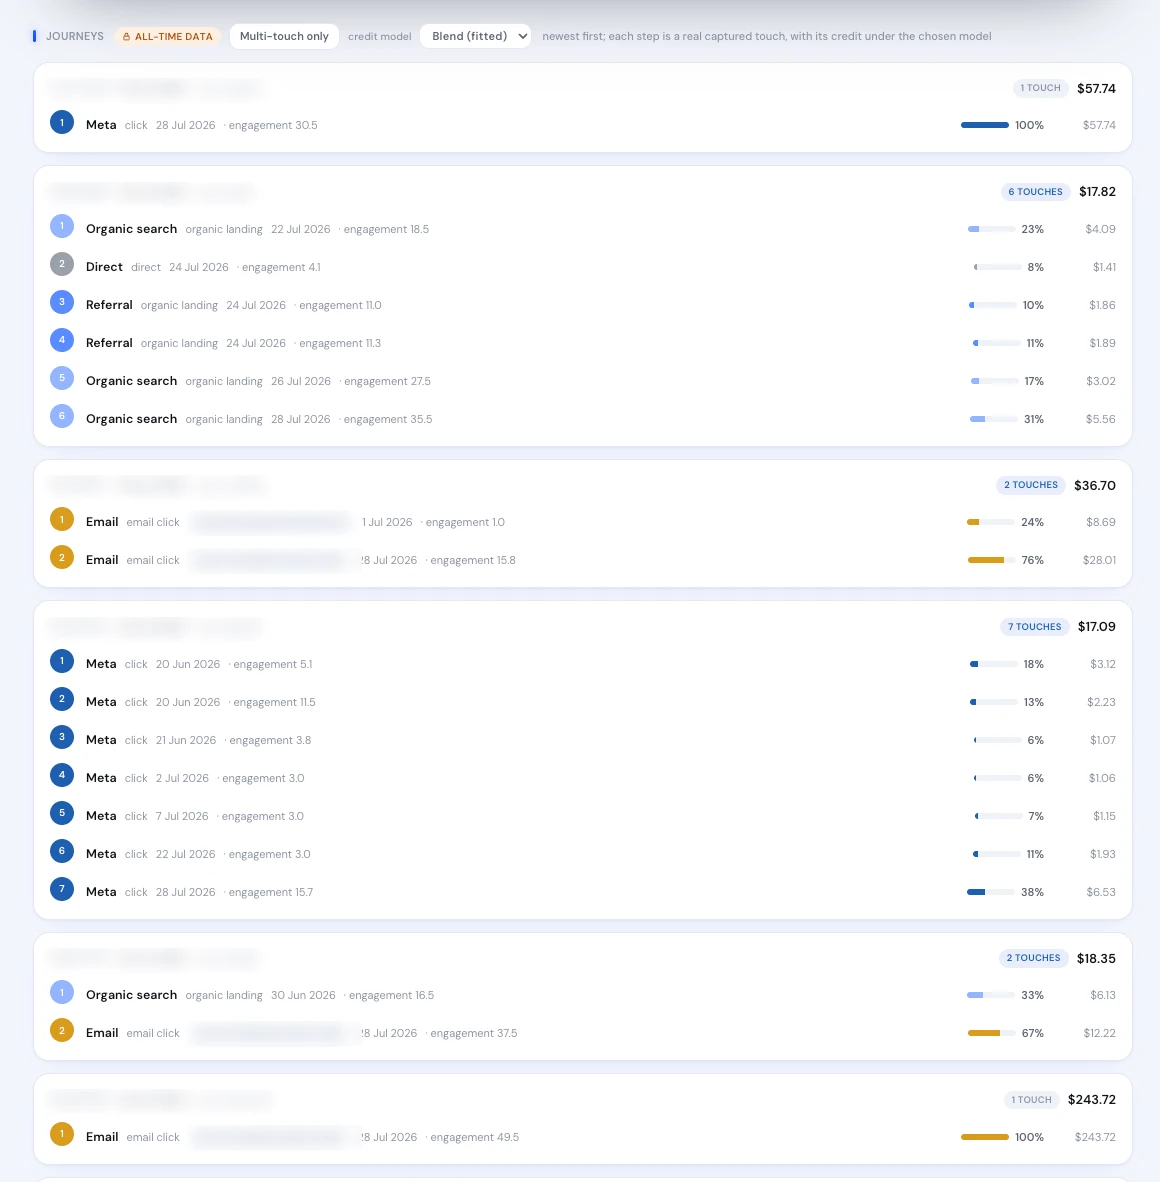
Real product screen, shown on sample data.
Section S5: every model on the table, one map published.
S5 reads every captured touch before an order: the ad click, the organic landing, the email click, the direct visit. The Journeys view lists each path newest first, with the credit each step earns under the model you choose, from a single Meta click that takes 100% to a seven-touch path where no step takes more than 38%.
Instead of asking you to pick the right model up front, it shows where the models agree and where they fight, then checks their claims against margin. What it publishes is the Canonical Source Map: a frozen first-purchase source per customer that channels, customer value and every other section read.
“I couldn't be more impressed with the Blufire team and the improvements they have made… working on the account and maximising results daily.”
 A$942kin incremental revenue once the double-counted attribution was fixedRead the case study →










The people who stop arguing about whose number is right.
Performance marketers use the matrix to see how much of a channel's reported return survives a change of model, and to catch UTM problems before they misroute a month of spend. Founders and CMOs use the Canonical Source Map as the single answer in the room when agencies, platforms and the email team each claim the same customers.
Finance reads the triangulation. Because each model's claims are checked against the margin that arrived, the acquisition story reconciles to the same CM1 the executive read reports. Attribution tells you who touched the sale, not whether it would have happened anyway; for that question, S5 hands over to Experiments and its holdouts.
Attribution today, and with S5.
Three dashboards each claim the same order in full.
One order carries one margin, split across its real touches.
The model is picked once and never questioned.
Models sit side by side in a comparison matrix, and their bias is visible.
Every report uses a different source for the same customer.
One Canonical Source Map, frozen per customer, read by every section.
Broken UTMs quietly move revenue between channels.
UTM hygiene and arrival-quality drift are flagged before the budget meeting.
What you can ask S5 that a platform dashboard will not answer.
- Who actually gets the credit for this sale?The core of who gets the credit: one order, one share of margin per touch, no double counting.
- Which model is flattering which channel?Last click loves branded search and email. First touch loves prospecting. The matrix puts them next to each other so the bias is visible.
- Where does the funnel leak?Paths that stall, channels whose arrivals rarely convert, and grades that drift week to week.
- Can we trust our UTMs?Untagged or mistagged traffic lands in the wrong bucket. S5 surfaces the hygiene problems before they bend a budget call.
One order, three claims, one margin to share.
An A$150 order with a 58% CM1. The customer clicked a Meta ad, came back through a Google search ad, then bought from an email. Each platform reports the full sale.
Added up, the dashboards say this order was worth three times what it was. Credit-split, the three touches share exactly the A$87 the order earned, so every channel's ROAS can be restated on margin without inventing revenue.
The same overlap happens across a whole account. Platforms can claim up to 140% of actual revenue, and Meta over-reports about 26% above third-party analytics on average (per the sources cited on The Math). See platform over-claiming for the full derivation.