92%
Know where the work comes from - and which we win.Sources ranked by win rate, not cost-per-click.
Channels ranks every acquisition source - repeat, referral, website, paid, partner - by the work it actually wins: enquiries, win rate, average deal value and cycle time. The cheapest source of enquiries is rarely the one that books the most revenue.
ChannelsDemonstrative data
Enquiry share by source · blended win-rate overlay
Repeat Referral Website Google Meta PartnerWin rate
Stacked share is where enquiries come from; the white line is blended win rate (right axis). Repeat +4pp and Referral +2pp over 13 weeks.
Enquiries
1,112
▲ 8%
Blended win
32%
▲ 2pp
Avg cycle
58d
▼ 4d
Top source
Repeat
30% share
Paid ROAS
9.2×
▲ 0.4×
Attrib. quality
91%
▼ 1pp
Service analytics from the team behind $150M+ in revenue influenced


What it answers
The questions your sales leadership lives with.
Not clicks and impressions. Which sources bring work you win, what each is worth, and where the next bit of effort belongs.
01
Which sources bring the work we actually win?
Win rate measured enquiry-to-won by source, so the channel that fills the calendar and the one that fills the bank are told apart.
02
What is our true win rate, by source?
Enquiry to closed, not lead to opportunity, with cycle time built in so slow-burning sources are not unfairly marked down.
03
Which sources are worth the sales effort?
Average deal value and cycle time per source, so you weigh a fast cheap channel against a slow lucrative one with eyes open.
04
Where do long-cycle sources eat margin?
Cycle time by source against win rate, so the channels that quote big but take months to close are visible.
05
Is our source mix shifting?
Enquiry share over time with the biggest movers flagged, so a quiet drift toward a weaker source is caught early.
06
Which sources should we double down on?
Every source on one board by win rate and value, so the next bit of sales effort goes where it pays.
Mix & win rate
See which sources actually close.
Sorted by enquiry-to-won conversion, with the change on the quarter, the enquiry count and the average deal value beside each. The picture a cost-per-lead report can never give you: which sources are worth your team's time.
- Ranked by win rate - not volume, not cost - what closes
- Value beside rate - average deal size per source
- Movement - the quarter-on-quarter shift, flagged
Channels · win rate by sourceLive
Win rate by source · enquiry to won, last 90 days
Repeat312 enq · avg $54k+3pp
46% win
Referral264 enq · avg $48k+1pp
38% win
Partner48 enq · avg $65k+4pp
30% win
Meta120 enq · avg $32k+0pp
30% win
Website184 enq · avg $42k-1pp
26% win
Google64 enq · avg $24k-1pp
21% win
Repeat and Referral close at nearly double the rate of paid search - but paid brings volume Repeat never will.
Per-source funnel
See where each source leaks.
A source can bring strong enquiries and still lose them late. The funnel grid runs every source through every stage on the same scale, so you can see exactly where a channel falls down and whether it is a top-of-funnel or a closing problem.
- Stage by stage - every source on the same scale
- Leak location - top-of-funnel vs closing, per source
- Best-in-column - the strongest source at each stage, marked
Channels · per-source funnelLive
Enq→Qual
Qual→Quote
Quote→Neg
Neg→Won
Repeat
88%
78%
72%
Referral
86%
82%
70%
65%
Meta
82%
76%
64%
55%
Website
78%
73%
58%
48%
Partner
74%
68%
52%
43%
Google
68%
60%
51%
40%
Each row is a source, each column a pipeline transition. Repeat stays tight through every stage; paid sources leak hardest at Negotiation → Won, the price-pressure stage.
Cycle × value
Weigh the fast-and-cheap against the slow-and-lucrative.
Two sources with the same win rate can behave completely differently: one closes small deals in a month, the other lands big ones over a quarter. Plotting cycle against value, sized by volume, shows the real shape of each source so you resource them deliberately.
- Three dimensions - cycle, value and volume in one view
- The sweet spot - fast, valuable and high-volume, surfaced
- The drag - slow sources that tie up the team, exposed
Channels · cycle × valueLive
Cycle time × deal value · sized by enquiry volume
Bottom-left is fast and cheap (Google); top-right is slow and lucrative (Partner). Repeat is the sweet spot - fast cycle, high value, high volume.
Where the numbers come from
Built on your systems, reconciled to your records.
Pipeline Money is not a parallel set of figures. It joins the systems you already run into one number that ties out, then keeps it current.
♿Your CRM
Every deal, stage, owner and close date. We map your real pipeline stages with you, so the funnel matches how your business actually sells.
↗Your marketing channels
Spend, clicks and campaigns from every paid source, joined to the deals they created with server-side tracking, lag-corrected to your sales cycle.
⚙Your operations software
Quoting, job management and finance, so contracted and settled revenue is grounded in delivery, not just CRM optimism.
Proof
What operators get when ROAS tells the truth.
When spend is judged on closed revenue, budget moves to what pays back and the waste becomes obvious. A sample of the outcomes.
 Field services
30:1return
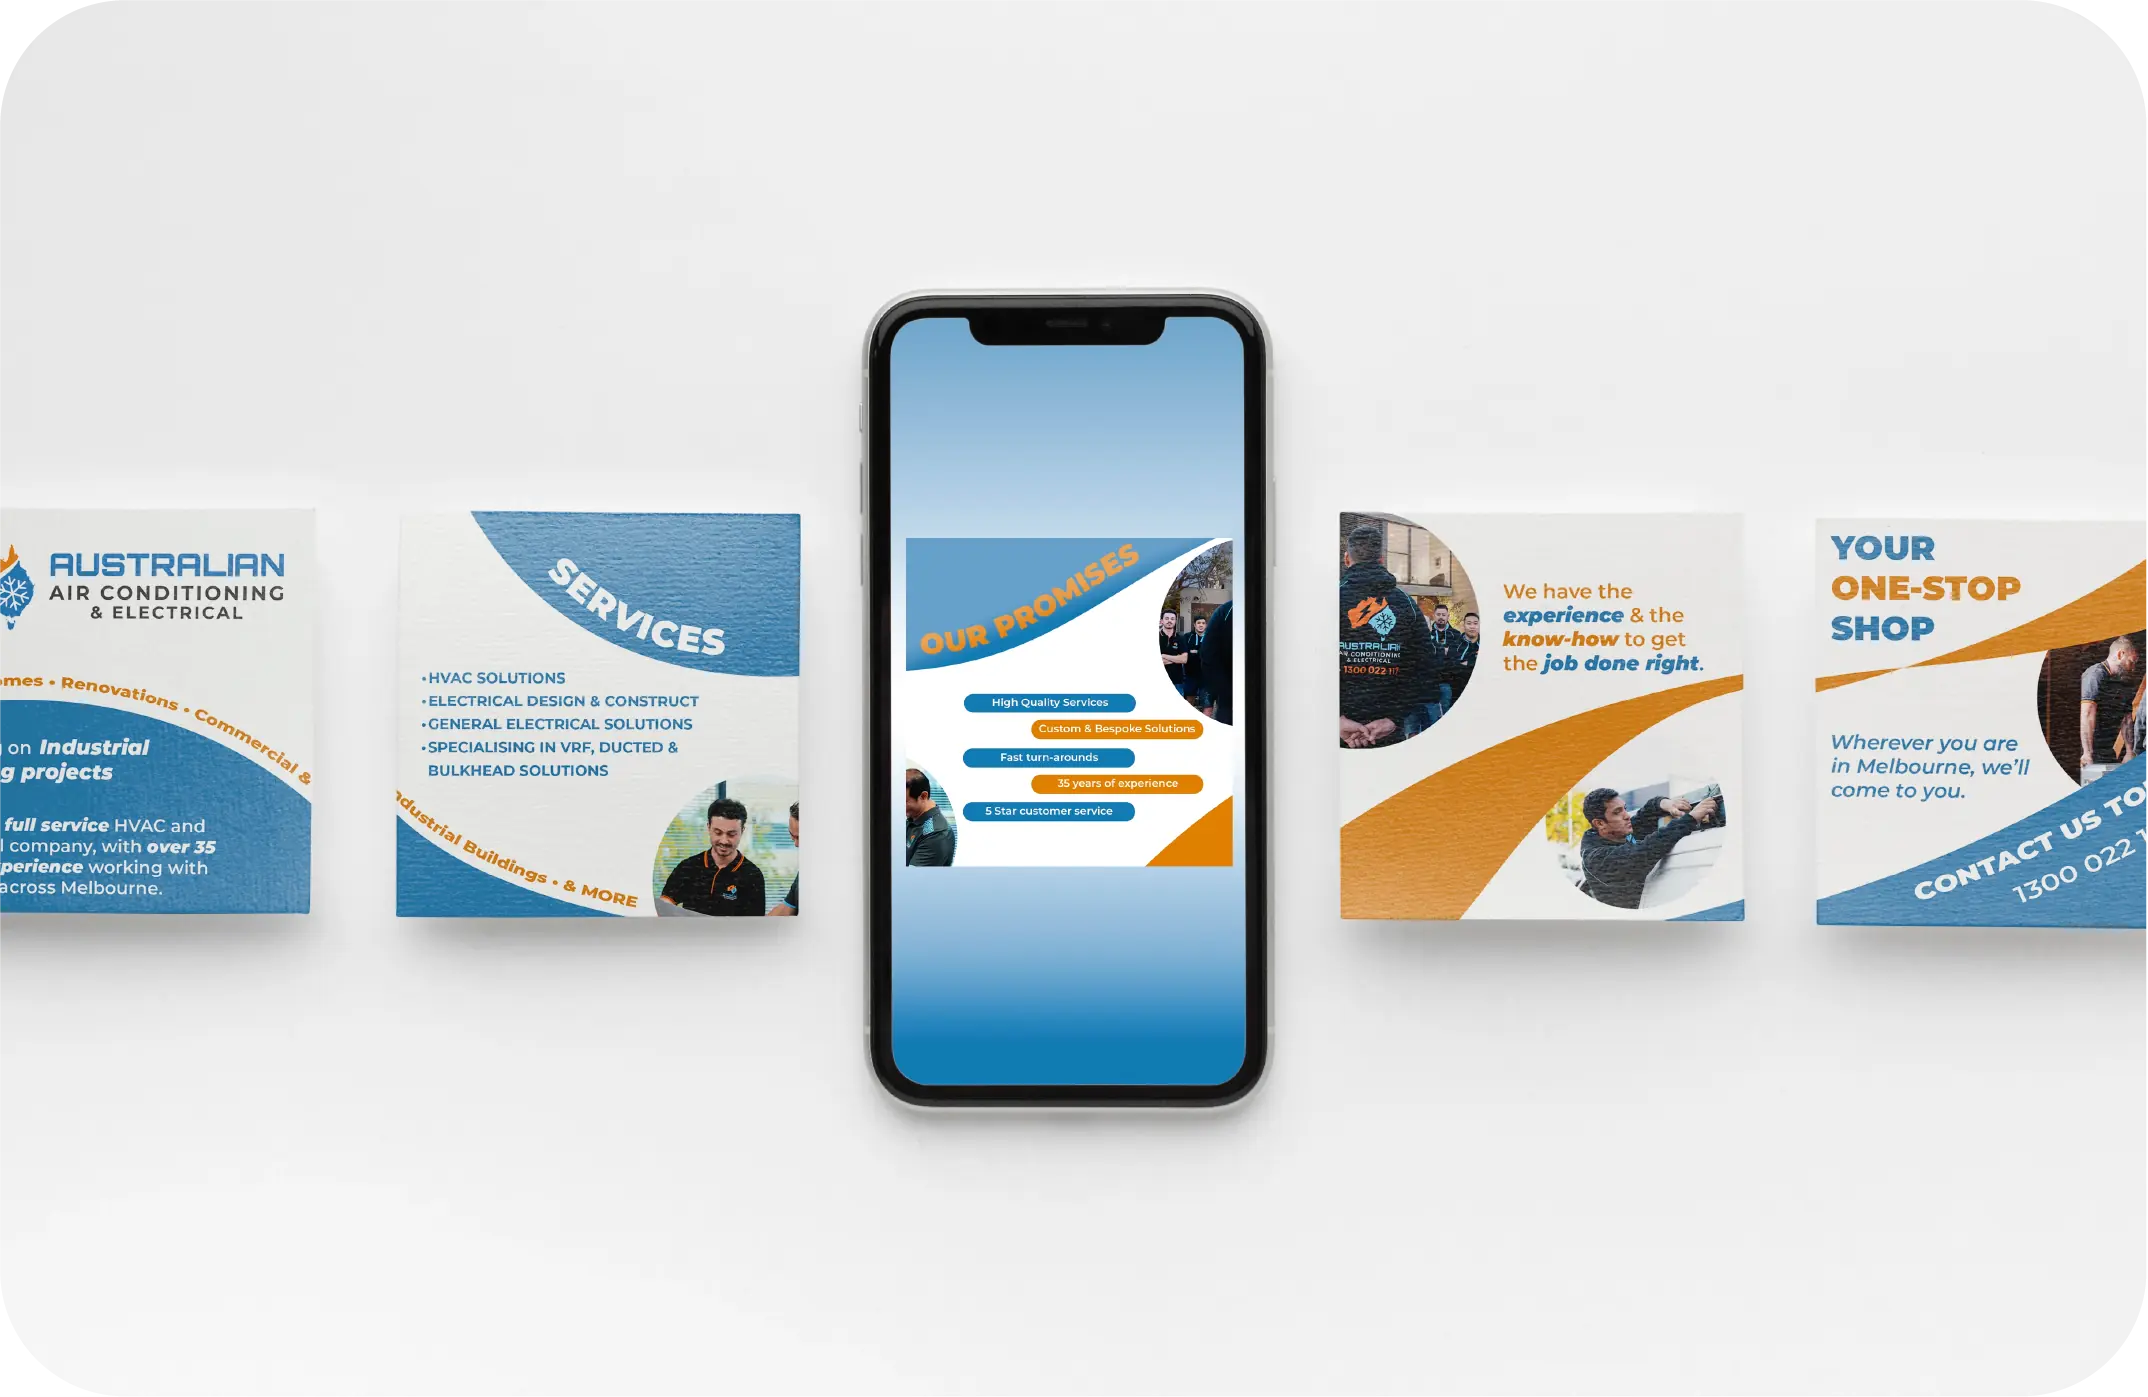
Australian Air Conditioning & Electrical
Heating & cooling
$3M in closed revenue from $100K of spend - 2,600 qualified enquiries traced to the jobs they became over twelve months.
Read case study →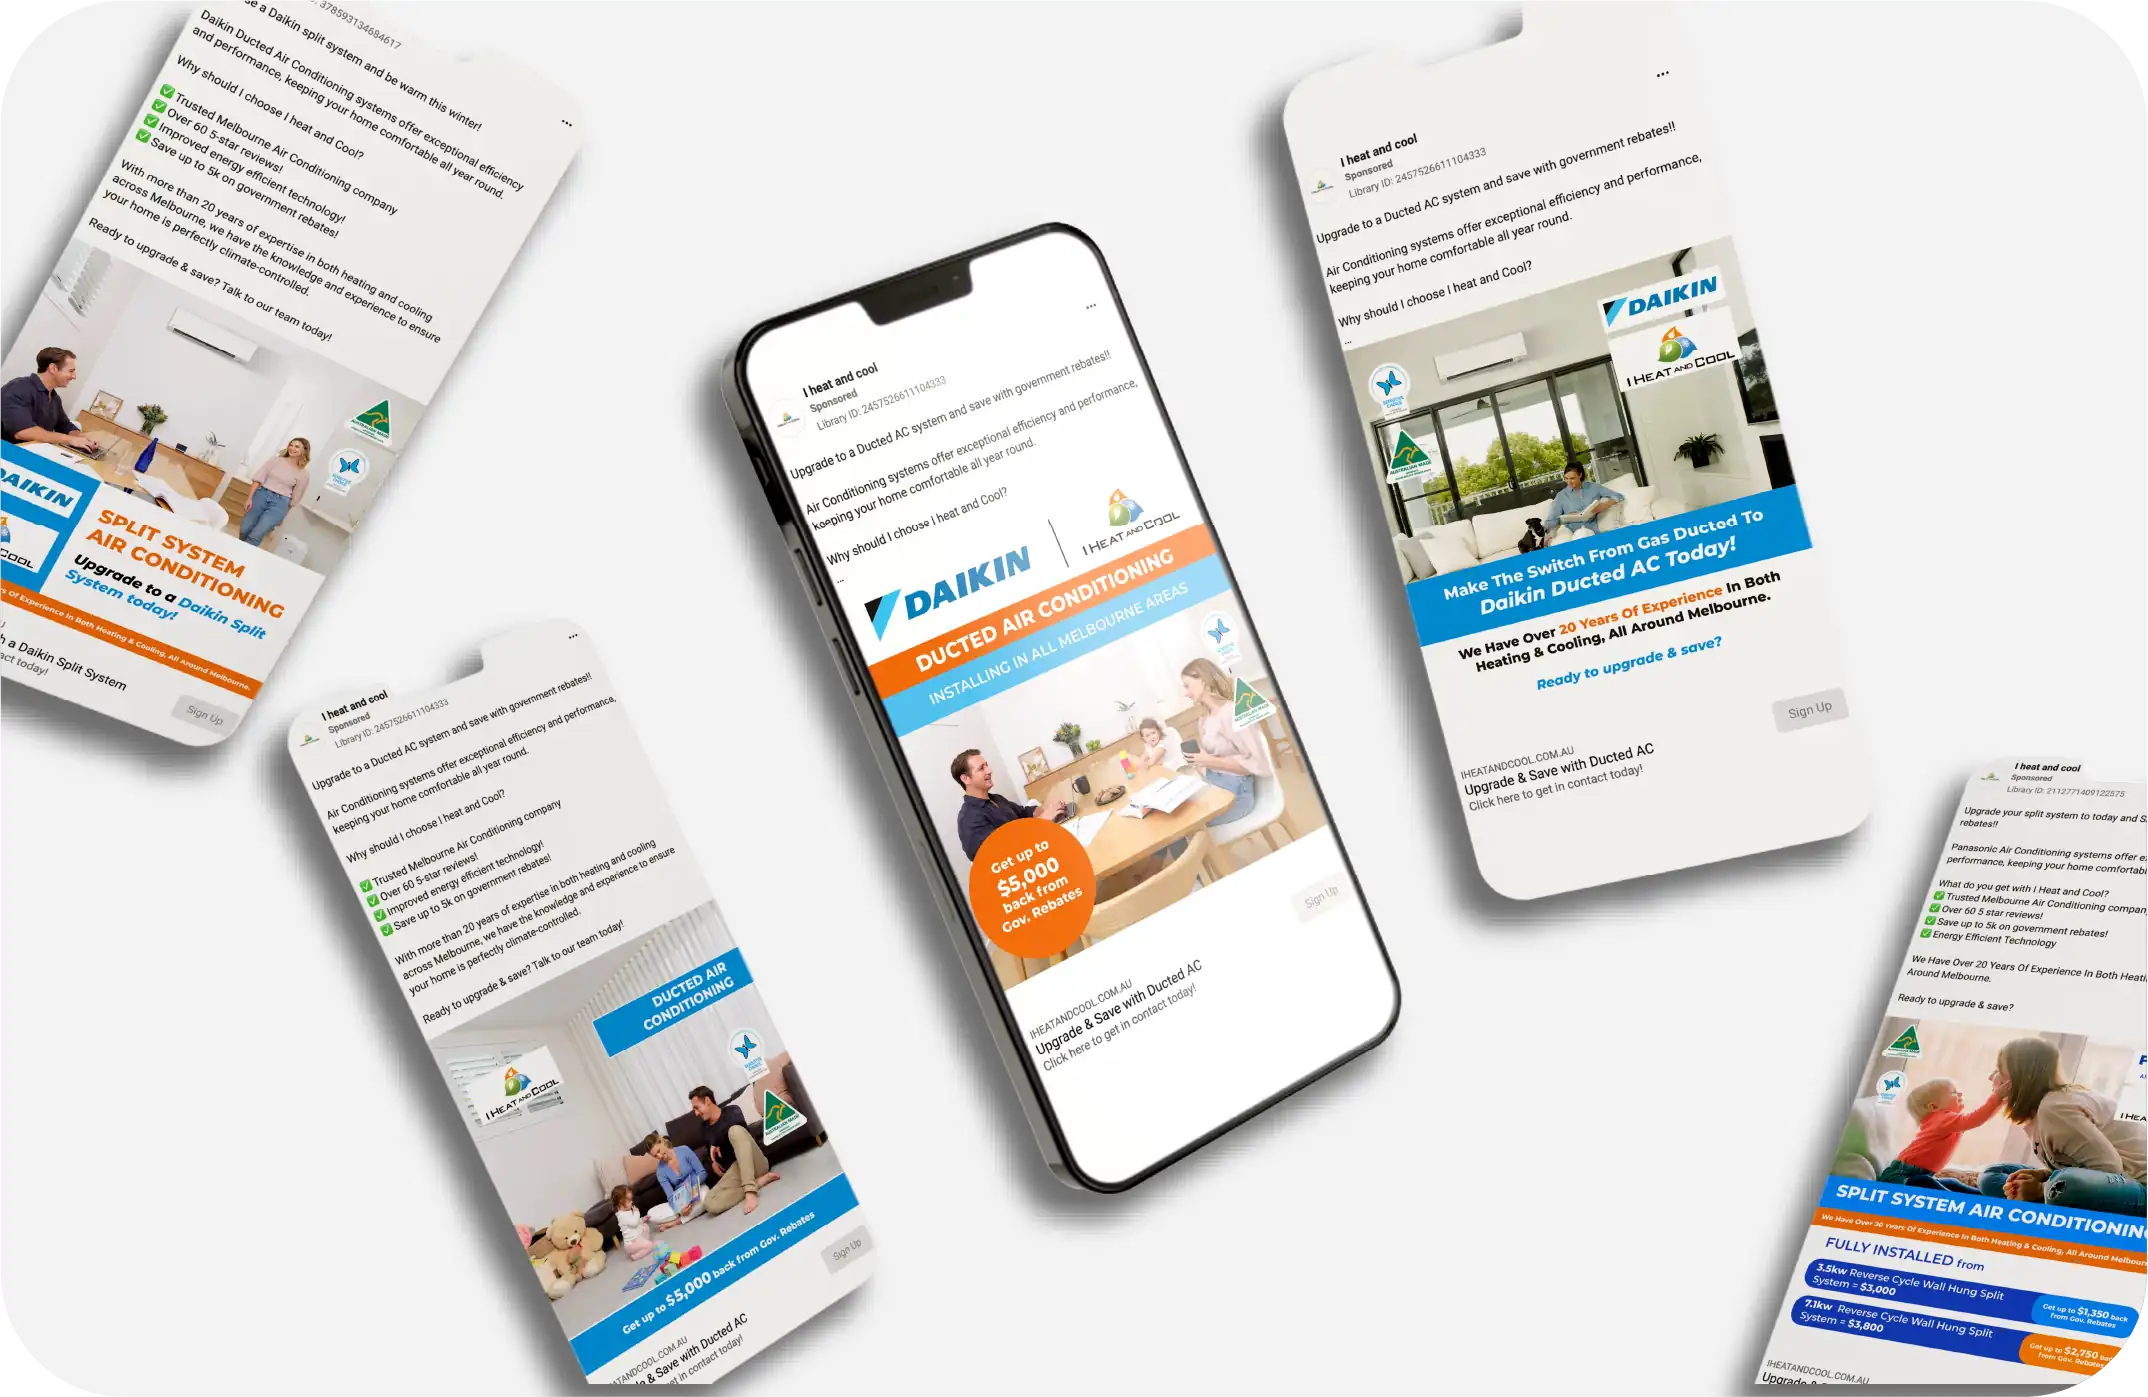 Field services
$5Mnew revenue
I Heat & Cool
Heating & cooling
A full year of new revenue with cost-per-deal cut from $90 to $41.95 once spend was judged on closed jobs, not leads.
Read case study → Field services
$840Kpipeline
King Cooling
Heating & cooling
1,500 enquiries at a $27 cost per enquiry, with 28% converting to booked jobs - visible, stage by stage, in one view.
Read case study →The rest of the picture
One view of nine.
Every dimension of your revenue, at the same depth, reconciled to the same source.
Pipeline Money →
Where revenue is won, contracted and in-flight.
Channels & ROAS ◆
Where spend pays back, to the campaign.
People & Performance →
Region, team and rep performance.
Won / Lost →
Why deals close or die.
Customers →
The full journey and where revenue concentrates.
Geography →
Postcode-level and branch benchmarks.
Persona Identification →
Who your best accounts are and where to find more.
Pipeline Economics →
CAC by stage, LTV:CAC, payback.
Questions
The things buyers ask.
Your ad platforms report return on platform-tracked conversions, often a lead or a form fill. We measure return on the revenue that actually closed in your CRM, lag-corrected for your sales cycle, so the figure reflects money, not events.
No. Spend is tied to the deals it created and projected through your real lag distribution, so recent channels are not unfairly marked down for revenue that has not landed yet.
Yes. We show credit under five attribution models side by side, so you can see how sensitive a channel's ROAS is to the model rather than trusting a single default.
No. We improve the signal, pushing value-weighted conversions back to your platforms, and hand your team the leaderboard. Your in-house team or agency keeps running the accounts.
Google, Meta, LinkedIn and Microsoft on spend; HubSpot, Salesforce and Pipedrive on revenue. Server-side tracking closes the loop between them.
See your true ROAS in your first weeks.
Connect your channels and your CRM. We tie spend to closed revenue, lag-correct it, and hand you the leaderboard that decides the next dollar.
01
Connect your stack
Ad platforms and CRM. No data team required.
02
Map your funnel
Your real stages, mapped with us.
03
Tie spend to revenue
Every click joined to the deal it closed.
04
See true ROAS
By channel, campaign and cohort.
05
Get the moves
What to scale, what to cut, priced.