Build vs Rent: the attribution engine decision
Every ad platform you run claims credit for the same sale. Together they will tell you they drove 85 to 140 percent of the revenue you actually made. This report works through the arithmetic of that gap, the four measurement methods that close it, and the real question underneath the dashboards: do you rent your measurement, or own it?

Open three ad accounts on the same week and add up the conversions. You will not find the number of sales your bank statement shows. You will find more. The platforms are not lying, exactly. Each one sees a slice of the buyer journey and claims the whole thing.
Consider one buyer. They see a TikTok video, search your brand on Google a day later, click, and then get served a Meta retargeting ad before they buy. That is one sale. But Meta counts it (a click within its window), Google counts it (a branded-search click), and TikTok counts it (a view-through). One purchase, three claimed conversions. Scale that across a quarter and the structural double-count is enormous: in one worked case, 650 real orders were reported as more than 1,200 platform conversions, an attribution inflation of roughly 85 percent (PantoSource, Multi-Platform Attribution, 2024). The measurement firm Measured documents cases where platforms collectively claim credit for 140 percent of actual revenue (Measured, Incrementality vs Attribution vs MMM decision tree, 2024).
The mechanism is mundane: mismatched attribution windows. Meta defaults to 7-day click and 1-day view. Google Ads uses a 30-day click window with data-driven attribution. TikTok leans on short view-through windows. Each platform applies its own logic to the same event, and none of them subtract the others. Add the modelled conversions that fill the gap left by Apple's App Tracking Transparency, and the over-count compounds.
Even if attribution were perfect, the number most teams optimise toward would still mislead them. Return on ad spend measures revenue per dollar, not profit per dollar. As the saying among finance teams goes, marketing reports a 4x ROAS and the CFO reports a loss, and both are correct. A 4x return on a 30 percent contribution margin is a very different business from a 4x return on a 70 percent margin.
The discipline that fixes this is simple and worth committing to memory. The breakeven point for ad spend is the inverse of your contribution margin.
This is why a profit-led read reframes the whole question. The metric that matters is not how much revenue a channel reports. It is how much durable contribution margin it generates per dollar and per day of effort, and how fast that margin pays back the cost to acquire. We call that rate Profit Velocity: durable contribution margin generated, divided by acquisition and operating cost, over time. ROAS sits one or two layers above the truth. Profit Velocity sits on it.
There is no single source of attribution truth. There are four methods, each answering a different question, each with a known blind spot. The mistake is asking one method to do another method's job.
The single most important operating principle is to optimise on marginal return, not average return. The first A$100,000 in a channel can carry a strong blended ROAS while the last A$50,000 is pure waste, because the easy buyers were always going to convert. Average ROAS hides this. Marginal-ROI curves, which MMM produces, expose it.
What incrementality actually finds
The gap between what platforms report and what advertising truly causes is not theoretical. The measurement firm Haus ran 640 Meta incrementality experiments (average 18.6-day test window with an 8.8-day post-treatment observation) and found Meta drove roughly 19 percent average lift to brands' primary KPIs, well below platform-reported credit (Haus, The Meta Report, 2025). Branded search typically shows only 20 to 40 percent incrementality, meaning 60 to 80 percent of those buyers would have arrived anyway; retargeting is often 40 to 70 percent non-incremental (Measured, 2024). In one documented Meta test, a platform-reported 4.8x ROAS proved to be 2.1x in true incremental terms, an overstatement of about 2.3 times.
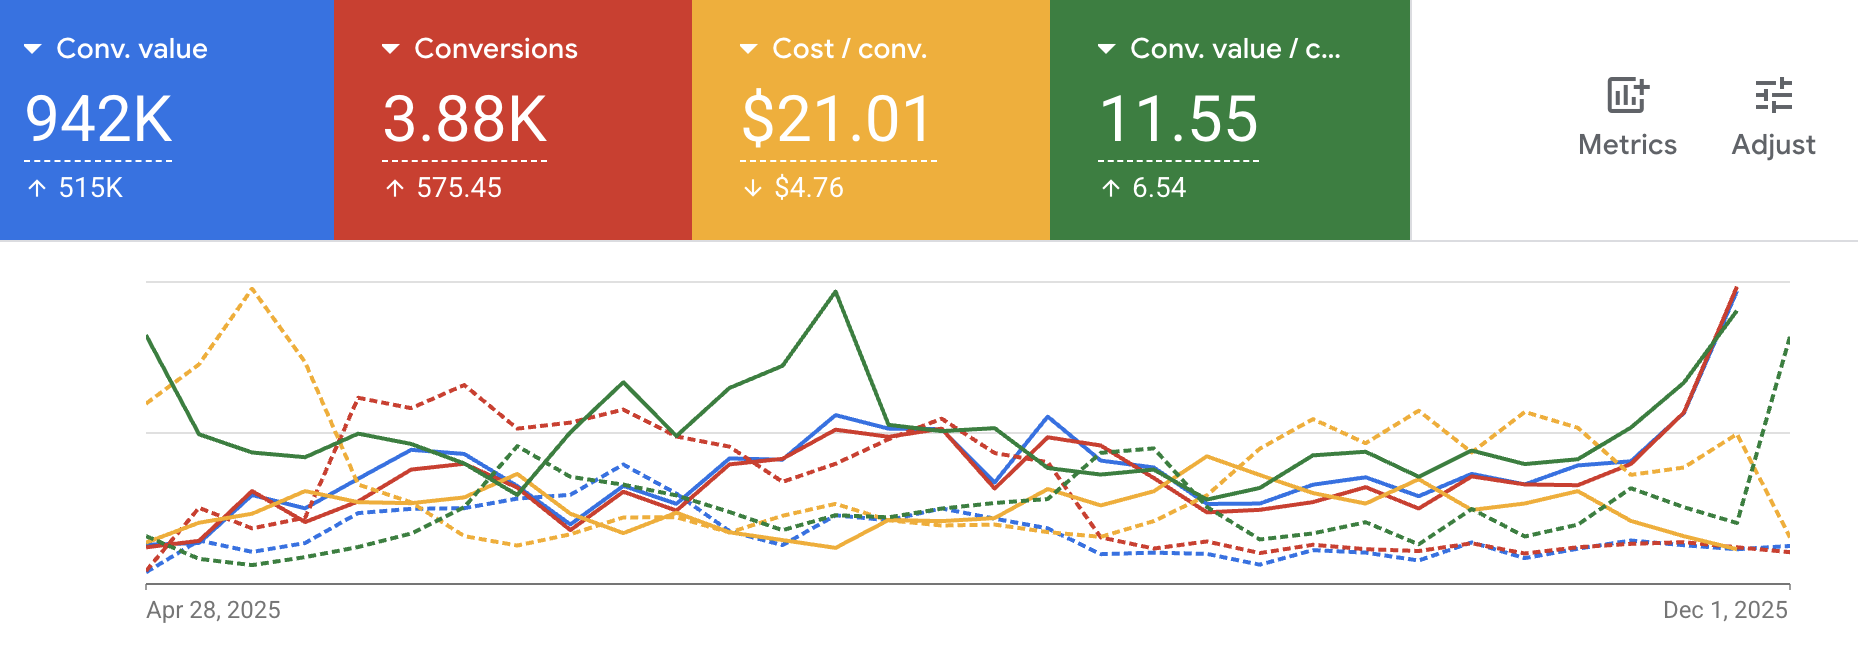
This is the chart that should worry anyone allocating on platform ROAS alone.
So how do you know which is which without running a thousand experiments? You triangulate. MMM finds where the saturation and the gaps are across all channels including offline. Geo holdouts and incrementality tests validate the suspicious ones causally. In-platform attribution optimises execution inside the boundaries MMM has set. Then experiment results feed back as priors that recalibrate the model. No single method is treated as truth; each checks the others.
The build-vs-rent decision, the maturity ladder, and the math behind owning your measurement.
You have read the diagnosis. The second half is the decision an operator actually has to make: when renting a platform's answer is fine, when it quietly costs you, and what owning a measurement spine looks like in practice. Enter your work email to keep reading.
Here is the question hiding under every attribution dashboard. When you buy a measurement tool, you are renting someone else's model of your business. That is often the right call. Sometimes it quietly becomes the wrong one.
Renting means a vendor owns the model, the assumptions, and increasingly your historical data. When their model updates, your numbers move, even though your business did not. When you outgrow the tool or it changes its pricing, your history can be hard to take with you. And every point tool measures its own slice, which is how you end up back at the 85-to-140-percent problem, just with a nicer interface.
Building does not mean writing your own MMM from scratch. The science is now open. Google's Meridian, a fully Bayesian marketing-mix model, became generally available and free on 29 January 2025, with full transparency into its code and methodology (Google, "Meridian is now available to everyone", Jan 2025). Geo-experimentation tooling such as Meridian GeoX and Triple Whale's GeoLift make causal holdouts practical. Building means owning the spine: the reconciled definitions, the contribution-margin layer, the triangulation logic, and the data, while renting the pipes that are genuinely commodity.
The market is already moving this way. Gartner's 2025 CMO Spend Survey found martech now absorbs about 22 percent of total marketing budgets, yet much of it sits underused or redundant, and 39 percent of CMOs plan to cut external agency spend to regain control and oversight (Gartner, 2025 CMO Spend Survey, fielded across North America, the UK and Europe). Australia shows the same direction of travel: IAB Australia's Market Mix Modelling Landscape Report 2025, prepared by its Ad Effectiveness Council, catalogues twelve active MMM vendors serving the local market and explicitly recommends that MMM sit inside a broader measurement framework alongside attribution and experimentation, not replace it (IAB Australia, MMM Landscape Report, Sept 2025). The capability that decides where money goes is exactly the capability worth owning.
The honest case against building
Building is not free, and pretending otherwise would be the kind of overclaim this report exists to argue against. MMM is still a model; it depends on assumptions, priors, and input quality. Geo calibration nudges probabilistically, it does not force a match. Incrementality experiments need real spend and operational discipline to run cleanly. Below a certain spend, the cost of standing up causal infrastructure outweighs the waste it would catch. Attribution is a tool, not a truth, and treating any single method as gospel, including your own, is the trap.
The right measurement stack is a function of spend. Below the threshold where waste is large enough to fund the infrastructure that catches it, simpler is correct. The ladder below reflects the stack Measured recommends by spend band (Measured, 2024).
The point of owning the measurement spine is not a prettier dashboard. It is decisions you can defend. When Blufire rebuilt measurement around contribution margin and causal validation rather than platform ROAS, the results showed up where they matter: in acquisition cost and incremental revenue, not in reported conversions.
That 53 percent CAC reduction is the kind of number that only appears when you stop trusting the platform's own report and start measuring what the spend truly caused. It is also the reason this is a build decision and not a buy-the-dashboard decision: the advantage compounds in the data you keep.
This report combines published, peer-reviewable measurement methods with cited industry research. The illustrative charts and worked examples are marked as demonstrative and use figures drawn from the cited ranges; they are not measured Blufire client aggregates. Methods described are standard and open; no proprietary model is exposed.
Primary sources cited
- Measured. Incrementality vs Attribution vs MMM: A Decision Tree for What to Use When (2024). 85-140% over-claim, branded/retargeting non-incrementality, 2.1x vs 4.8x test, 10-25% efficiency gain, spend-band stack.
- Haus. The Meta Report: Lessons from 640 Incrementality Experiments (2025). ~19% average lift; 18.6-day test window.
- Google. "Meridian is now available to everyone" (29 Jan 2025). Open-source Bayesian MMM, generally available and free.
- Gartner. 2025 CMO Spend Survey (May 2025, fielded across North America, the UK and Europe). Martech ~22% of marketing budget; 39% of CMOs cutting external agency spend.
- IAB Australia. Market Mix Modelling Landscape Report 2025 (Ad Effectiveness Council, Sept 2025). Twelve active MMM vendors in the AU market; MMM as part of a broader measurement framework, not a replacement for attribution and experimentation.
- DOJO AI. Meta Ads Attribution 2026. Meta ~26% over-reporting; Google ~15-20% under modelling.
- PantoSource. Multi-Platform Attribution (2024). 650 real orders reported as 1,200+ platform conversions.
- Finaloop / Onramp. Contribution-margin and gross-margin-by-vertical ranges (2024), used for the demonstrative margin figures.
Most consumer businesses run on a revenue number a CFO does not trust and a margin number nobody forecasts. This report sets out the operating model that fixes both: a margin ladder reconciled to source, a variance loop that explains the miss, a forecast with an honest horizon, and one metric that ties marketing effort to durable profit.
Your platforms claim up to 140% of the sales you actually made. This report separates reported ROAS from incremental profit, shows the math for where the next dollar belongs, and gives a defensible method for the only question a CMO should answer to the board: what is working, and what should we fund next.