The Marketing Profitability Report
Your platforms claim up to 140% of the sales you actually made. This report separates reported ROAS from incremental profit, shows the math for where the next dollar belongs, and gives a defensible method for the only question a CMO should answer to the board: what is working, and what should we fund next.

Revenue is reported. Profit is earned. Most marketing is measured on neither.
Three platforms can each take full credit for one sale. A dashboard can show a 4x return while the business loses money on every order. Both happen because the numbers a marketing team steers by, platform-reported ROAS and last-click conversions, were never built to answer the question the board is actually asking: is the next dollar of spend going to make us money, and where should it go?
This report takes that question apart. It is written for marketing leaders inside Australian businesses turning over A$5M to A$1B, and it assumes you already know your channels. The stakes are local and large: Australians spent A$82.6B online in 2025, up 14% year on year (Australia Post, 2025), and Australian advertisers put A$18.4B into internet media chasing it (IAB Australia / PwC, 2025). What follows is the measurement layer most teams skip: how to read reported numbers against incremental truth, how to compute the breakeven return your margin demands, how to find the point where another dollar stops paying back, and how to assemble a measurement stack proportional to your spend. The math is standard and shown in full. The point of view is not.
- Platforms over-claim, predictably. Independent analysis finds platforms collectively claim credit for up to 140% of actual revenue (Measured, 2025). Meta typically over-reports conversions by 15-30% against independent measurement, and Google over-attributes once modelled conversions kick in (DOJO AI, 2026; Measured, 2025).
- ROAS is not profit. Breakeven ROAS is 1 / contribution margin. A brand on 40% margin needs at least 2.5x just to cover variable cost (Saras Analytics, 2025). The headline number tells you nothing without that denominator.
- Spend on the margin, not the average. The first $100k of a channel can carry strong average ROI while the last $50k is wasted. The decision is always marginal. We show how to read the curve.
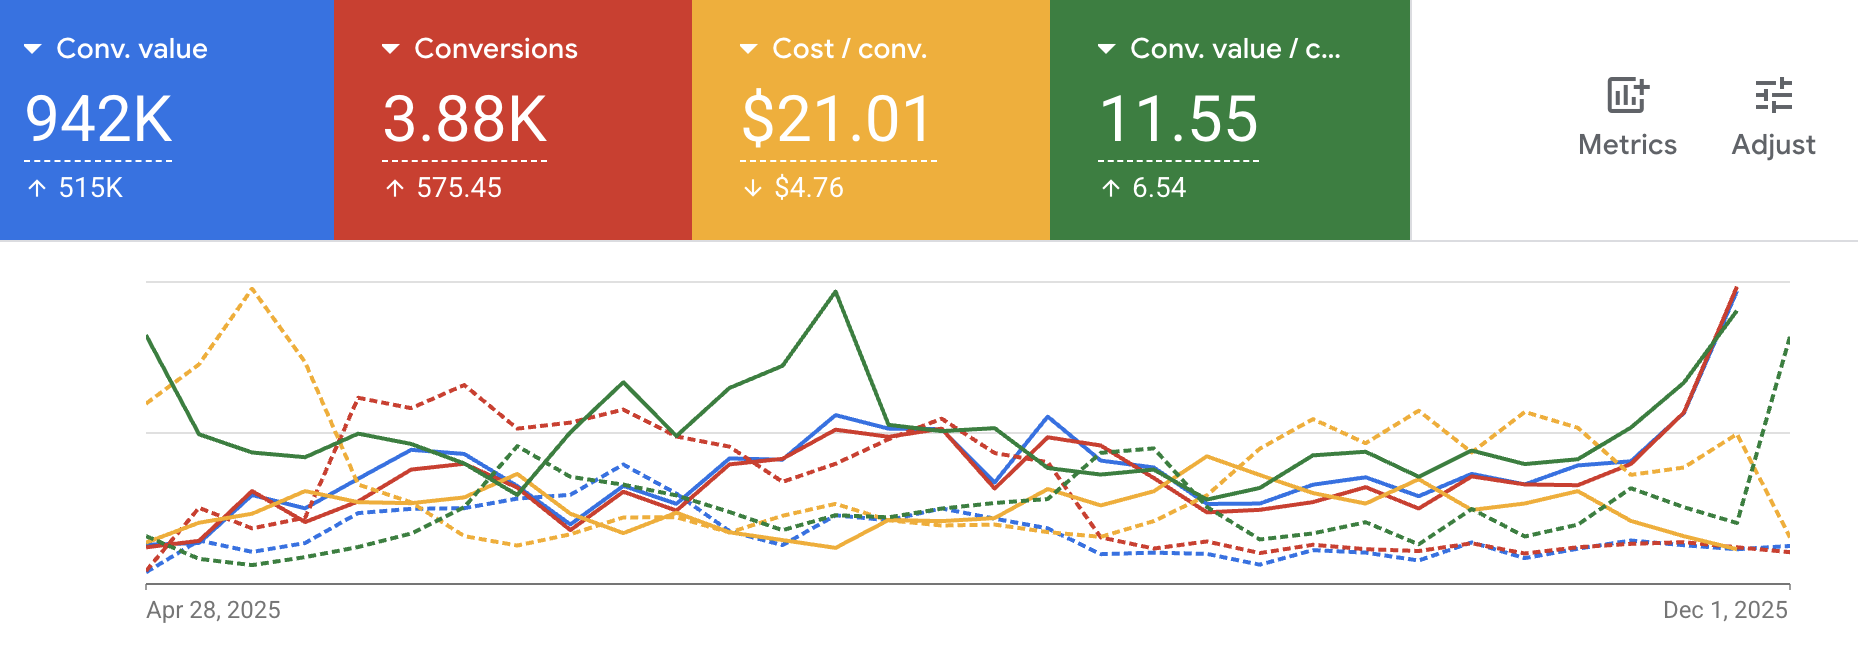
A note on the headline metric used throughout: Profit Velocity, the rate at which marketing converts spend into durable contribution margin. It rises when incremental, fast-paying-back spend grows and falls when budget sits in non-incremental channels.
Why three platforms all claimed the same sale.
One buyer sees a paid social ad, clicks a branded search result, then sees a retargeting impression before purchasing once. Each platform records that sale under its own attribution window: Meta on a 7-day click and 1-day view, Google on a 30-day click, the social platform on a 1-day view. One real order becomes three reported conversions. Scaled across an account, 650 real orders are routinely reported as 1,200 or more platform conversions, an over-statement of roughly 85% (PantoSource, 2025). Measured documents cases where platforms collectively claim credit for 140% of actual revenue (Measured, 2025).
The over-statement is not random noise that nets out. It is structured, and it concentrates in the channels closest to a purchase that was going to happen anyway. The chart below pairs platform-reported ROAS against incremental ROI measured by geo holdout for the same channels. The gap is the part of the credit the channel did not earn.
| Channel / platform | Over-statement | Why it over-claims | Primary source |
|---|---|---|---|
| Meta (blended) | 15-30% more conversions | Modelled conversions + last-event attribution | DOJO AI, 2026 |
| Google Ads | 15-20% | Enhanced Conversions / Consent Mode V2 modelling | Measured, 2025 |
| Branded search | 60-80% non-incremental | Buyers already intended to find you | Measured, 2025 |
| Retargeting | 40-70% non-incremental | Re-touches buyers already in the funnel | Measured, 2025 |
The practical consequence: if you reallocate budget towards whichever channel reports the highest ROAS, you systematically over-fund the channels that take credit for demand they did not create. The fix is not a better dashboard. It is a method that distinguishes reported from incremental, which is the rest of this report.
A 4x return can still be a loss. Here is the arithmetic.
Return on ad spend measures revenue per dollar of media. It says nothing about what is left after the cost of the goods, the shipping, the fees and the discount. Two brands can both report 4x and one is printing money while the other is funding its own decline. The reconciliation is a single formula every marketing leader should be able to write from memory.
The derivation is one line. Let revenue from a campaign be R, ad spend be S, and contribution margin be m (as a fraction). Variable profit before media is mR. The campaign breaks even when that profit covers the media: mR = S. Since ROAS = R / S, dividing gives ROAS = R / S = 1 / m. So the minimum return that covers variable cost is the inverse of the margin (Saras Analytics, 2025).
This is why the report steers by contribution and payback rather than ROAS. The table below shows breakeven ROAS at common margin levels. Notice how unforgiving low-margin categories are: at 25% margin, the floor is 4x, and most paid channels do not clear it once you net out non-incremental credit.
| Contribution margin | Breakeven ROAS | Read |
|---|---|---|
| 70% | 1.43x | High-margin (beauty, supplements): wide runway |
| 50% | 2.00x | Healthy DTC: most prospecting clears this |
| 40% | 2.50x | The common case (Saras, 2025) |
| 25% | 4.00x | Finaloop median CM ~25%: thin runway |
| 15% | 6.67x | Electronics, marketplace resale: paid rarely pays |
Margin context: Finaloop's dataset of hundreds of 7- and 8-figure brands (US$3.16B in tracked sales, 2023-2025) puts median contribution margin at about 25%, with a quartile spread of 3% to 56% (Finaloop, 2024). It is a US/global benchmark; AU brands sit in a comparable band, with freight and a smaller domestic market often compressing it further. Half of mid-market ecommerce brands operate with a breakeven ROAS at or above 4x, which most paid channels cannot clear on an incremental basis. That single fact reframes the entire allocation problem.
The rest of this report is the part that changes the budget.
You have the diagnosis. What follows is the prescription: the four measurement methods and what each one can and cannot answer, the marginal-ROI math for where the next dollar belongs, the channel-by-channel payback ladder, and the measurement stack to run at your spend level. Read by marketing leaders at 100+ brands.
Four methods. Each answers a different question. None answers all of them.
There is no single source of attribution truth, and any vendor who tells you otherwise is selling the overclaim this report warns against. The credible approach is triangulation: use each method for the question it actually answers, and let the methods check each other. Here is what each one is for.
Credits the final touch. Useful for operational routing and for understanding the bottom of the funnel. Blind to demand creation: it gives all credit to the channel that happened to be last, which is why it over-rewards branded search and retargeting.
Weights touches by comparing the paths of converters against non-converters (the logic in GA4 and platform DDA). Closer to truth than first or last click, but still a correlational model on observed paths. It can miss incrementality entirely because it never runs a control.
Top-down regression that separates base demand from incremental lift across every channel, including offline, using spend and external factors. Outputs marginal-ROI curves and saturation points. It is still a model that depends on its priors and input quality, but it is the only method that sees the whole budget at once. Google's open-source Bayesian MMM, Meridian, went generally available in early 2025 (Google, 2025).
Test-and-control, usually geo holdouts: hold spend out of matched regions, in an Australian account typically a state or metro split (for example hold WA or SA while NSW and VIC run), and measure the difference. The only method that proves causation rather than inferring it. Bounded by needing real spend, clean geos and operational discipline, but it is the ground truth the other three calibrate against.
The closed loop that credible teams run: MMM finds where a channel is saturated or under-funded, geo experiments validate the biggest bets causally, last-click and DDA optimise execution inside the boundaries MMM sets, and the experiment results feed back as priors that recalibrate the model. No single box is the answer. The system is (EC Digital Strategy, 2025; Measured, 2025).
Spend to the margin, not to the average.
The single most expensive mistake in budget allocation is optimising on average ROI. Average return is backward-looking and flattering: it blends the highly productive first dollars of a channel with the wasted last ones. The decision in front of you is never the average. It is whether the next dollar pays back, which is the marginal return.
Channels saturate. As spend rises, you exhaust the most responsive audience first, so each additional dollar buys less response. The cumulative response curve is concave, and its slope, the marginal return, falls as you scale. The chart shows both: average ROI stays comfortably high well past the point where the marginal dollar has stopped paying back.
A brand on 43% contribution margin (breakeven 2.33x) is considering its next A$100k. Two channels report similar average ROAS, but their marginal returns diverge.
Payback is the constraint ROAS forgets.
Even a profitable customer can sink you if the cash comes back too slowly. Acquisition cost is paid upfront and in full; the contribution that repays it arrives in lumps over the customer's life. CAC payback period is the number of months until a customer's cumulative contribution profit repays the cost of acquiring them. It captures the cash-flow reality ROAS ignores (Saras Analytics, 2025).
Payback varies by an order of magnitude across categories, which is why a CAC that is healthy for one business is fatal for another. The curve below traces cumulative contribution against acquisition cost; the payback point is where it crosses zero.
| Category | Payback | Implication for paid spend |
|---|---|---|
| Food & beverage | 1-3 months | Recycle budget fast; aggressive acquisition viable |
| Beauty / personal care | 2-4 months | Strong repeat funds rapid scale |
| Supplements / wellness | 3-6 months | Subscription replenishment shortens payback |
| Fashion / apparel | 3-6 months | Returns drag; watch CM2 carefully |
| Home goods | 3-6 months | Long repeat cycle; first order must pay back |
| Electronics / tech | 6-12+ months | Thin margin + slow repeat: paid rarely scales |
Source: Eightx, citing Optifai CAC Payback Benchmarks (Q2 2025-Q1 2026, 939 companies) and public 10-K filings (Olaplex, Warby Parker, BARK), 2025. By platform, payback typically runs under 60 days on Amazon, 90-120 days on Shopify, and around 180 days for pure D2C (Eightx, 2025). Read CAC against payback, never alone: a high-category retail CAC of US$377 for electronics (Shopify by-industry, 2021, US and global DTC; about A$573 at US$1 = A$1.52) is excellent at a 2-month payback and ruinous at 14.
Match the measurement stack to the spend it governs.
Measurement should cost a fraction of what it governs and should get heavier as the budget it steers gets larger. A A$500k-a-year programme does not need continuous MMM; a A$30M one cannot be run without it. The ladder below is the spend-proportional stack credible practitioners recommend (Measured, 2025). For scale, Australian internet ad spend reached A$18.4B in 2025, with search alone at A$8.0B (IAB Australia / PwC, 2025), so these tiers sit inside a market that is itself demanding stronger attribution, MMM and incremental-lift measurement.
| Annual spend | Run this | Why |
|---|---|---|
| Under A$1M | Platform attribution + 1-2 incrementality tests/year | MMM is overkill; a couple of geo holdouts on the biggest channels catch the worst overclaim |
| A$1M - A$5M | Attribution + selective channel testing | Test the channels you suspect are non-incremental (branded, retargeting) before scaling them |
| A$5M - A$20M | All three, integrated | Attribution for execution, MMM for allocation, incrementality to calibrate; the loop pays for itself |
| A$20M+ | Continuous MMM + ongoing incrementality programme | At this scale a 10% misallocation is millions; the model and the experiments run permanently |
The payoff is not theoretical. Brands that adopt triangulated measurement typically see 10-25% efficiency gains from causally validated reallocation, without increasing total spend (Measured, 2025). That is budget moved off non-incremental channels and onto ones whose marginal dollar still pays back. It is the cleanest lever a CMO has.
Why you will never see every conversion again, and why that is fine.
Privacy changes made part of the measurement gap permanent. Since iOS 14.5, ATT opt-in has plateaued: cross-category averages sit in the low-to-mid 30s, but shopping and finance apps, the relevant ones here, run near 18-25% (Adjust, 2025). Marketers now commonly see only 40-60% of actual conversions in deterministic platform reporting, with modelled conversions making up another 20-35% and the remainder never directly observed (Measured, 2025; DOJO AI, 2026). The gap will not return to pre-2021 levels, and it applies the same way to Australian advertisers buying on the same global platforms.
What this looks like when the allocation is right.
Measurement is only worth the discipline if it changes the budget and the budget changes the result. Two engagements from the Blufire portfolio show the pattern: spend moved towards incremental, fast-paying-back acquisition, and the profit, not just the revenue, followed.
Across 100+ brands, the Blufire portfolio has influenced $150M in revenue at an average 32.5% CAC reduction. Awarded AFR Fast 100 (#18, 2025) and Best Google Ads Campaign, APAC. Figures are real client outcomes from completed engagements.
How to read the numbers in this report.
External statistics are cited inline to their primary source and year. Charts and worked examples marked Demonstrative data use illustrative figures chosen to show the method; they are not measured Blufire aggregates, and the structure is built so real client data drops into the same shape. Incrementality and over-attribution ranges (branded search 20-40% incremental, retargeting 40-70% non-incremental, Meta ~26%, Google 15-20%) are published findings, not Blufire measurements. Real Blufire client outcomes appear only in the named case callouts and headline proof, and are drawn from completed engagements.
The mathematics is standard and shown in full: breakeven ROAS as the inverse of contribution margin, the marginal-vs-average allocation condition, and CAC payback as acquisition cost over monthly contribution. No proprietary model, weighting or implementation is described; the methods named here (last-click, DDA, MMM, geo-holdout incrementality) are the public, textbook approaches.
- Measured, Incrementality vs Attribution vs MMM decision tree (2025): 140% collective over-claim; branded/retargeting incrementality; stack by spend; 10-25% efficiency gain.
- PantoSource, Multi-Platform Attribution (2025): the 650-orders-to-1,200-conversions over-counting mechanism.
- DOJO AI, Meta Ads Attribution 2026: Meta over-reporting of 15-30% against independent measurement; reported-vs-incremental ROAS gap; deterministic/modelled conversion split.
- Saras Analytics, ROAS vs Contribution Margin and CAC Payback Period (2025): breakeven ROAS = 1 / CM; payback definition.
- Finaloop, Ecommerce Profit Benchmarks (2024): median contribution margin ~25%, 3-56% quartile spread, US$3.16B tracked sales (2023-2025 data). US/global dataset.
- Eightx, citing Optifai CAC Payback Benchmarks (939 companies, 2025-2026) and public 10-Ks: payback by vertical and platform.
- Google, Meridian is now available to everyone (2025): open-source Bayesian MMM, general availability early 2025.
- Adjust, ATT opt-in rates 2025: opt-in plateaued; shopping/finance apps near 18-25%, cross-category average in the low-to-mid 30s.
- IAB Australia / PwC, Internet Advertising Revenue Report (2025): Australian internet ad spend A$18.4B in 2025 (search A$8.0B); industry prioritising attribution, MMM and incremental-lift measurement. AU market context.
- Australia Post, Inside Australian Online Shopping / eCommerce Report (2025): Australians spent A$82.6B online in 2025 (+14% YoY), 24% of retail. AU market context.
- EC Digital Strategy, Attribution Trust Crisis (2025): triangulation and the anti-overclaim discipline.
- Shopify, "Customer Acquisition Costs by Industry": by-industry annual average CAC of electronics US$377, fashion and home US$129, health and beauty US$127 (data collected 2021, brands with fewer than four employees; US and global data, about A$573 for electronics at US$1 = A$1.52). Primary-published, used here as a directional all-in benchmark; no Australian retail CAC is published to a primary source, and AU acquisition costs differ by channel mix and category.
See this on your own numbers.
The companion CMO measurement view applies this method to your channels: reported vs incremental, breakeven ROAS on your margin, and where the next dollar belongs.
Most consumer businesses run on a revenue number a CFO does not trust and a margin number nobody forecasts. This report sets out the operating model that fixes both: a margin ladder reconciled to source, a variance loop that explains the miss, a forecast with an honest horizon, and one metric that ties marketing effort to durable profit.
Every ad platform you run claims credit for the same sale. Together they will tell you they drove 85 to 140 percent of the revenue you actually made. This report works through the arithmetic of that gap, the four measurement methods that close it, and the real question underneath the dashboards: do you rent your measurement, or own it?